Keeping up with new services, new deployments, and new features in your Azure environment is more than a full-time job. You need a fully-automated, cloud-native monitoring tool that is constantly looking for relevant events and actionable insights.
Create a new read-only app registration in Active Directory. Provide the Subscription ID, Application (client) ID, Directory (tenant) ID, and Secret.
Set up notifications to match your workflow in Slack, OpsGenie, email, or others. Specify whether to receive alerts, warnings, anomalies, or a mix of events.
Watch the dashboard, Slack channels, and incident management tools for events. Use the timeline to diagnose root causes. Become all-knowing about your infrastructure overnight.
We gather baselines to understand usage patterns.
We maintain dynamic thresholds that change every minute.
We triage all events into alerts, warnings, and anomalies.
When the issue is over, we update the dashboard and notifications.
All of your resources in every region and availability zone will be discovered and monitored automatically.


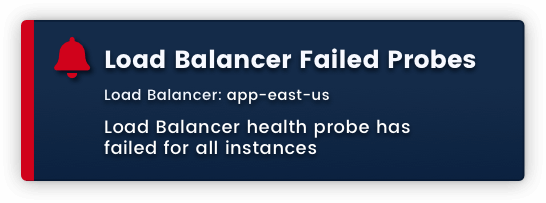
We monitor the health of every one of your load balancers through Azure’s health probes, and support both the Basic and Standard types as well as the Public, Internal, and NAT configurations. As VMs in your backend pools fail health probes, we’ll notify your team when it’s time to act.
Our full coverage of Load Balancer also includes monitoring on bytes processed and SNAT allocation.
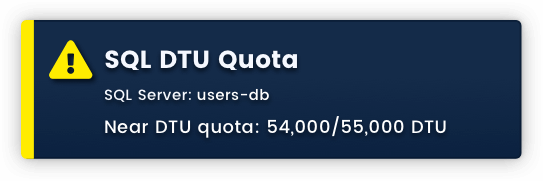
We monitor Database Transaction Units (DTUs) in your SQL databases. DTUs are used to measure reads, writes, CPU, and memory and have strict limitations that can be raised with a support ticket. As your DTU usage increases, we will project usage and notify you before you reach the limit. A warning tells you to ask for a usage increase before it prevents you from scaling.
Our full coverage of SQL also includes monitoring on failed connections, OLTP storage, SQL workers, storage, deadlocks, and more.
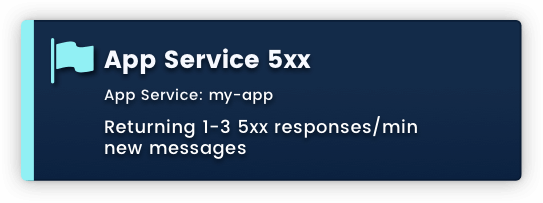
We monitor the number of 4xx and 5xx error responses from your App Service. Your services are baselined to understand normal number of errors, and then a dynamic threshold is created that adjusts itself on a minutely basis. When you spike on errors, the system notifies you.
Our full coverage of App Service also includes monitoring on IO operations, latency, request queue, service state, network traffic, and more.
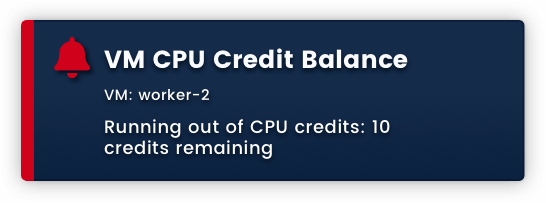
We monitor your CPU credit balance for Azure VMs. Each VM has a burstable credit that it earns over time. Running out of CPU credits results in throttling, CPU steal time, slow processing, and errors to users. We’ll track your usage and balance for you.
Our full coverage of Azure VMs also includes monitoring on disk IO, network IO, CPU utilization, and more.
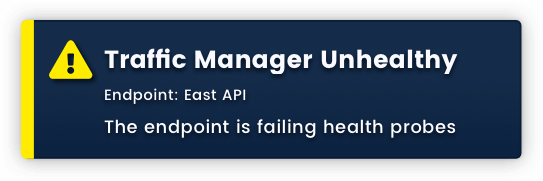
We monitor your endpoints and profiles in traffic manager and notify you when any of them become unhealthy. Notifications for failed probes are specific to the probes, so you’ll know exactly which one failed and when.
Microsoft® Azure is a minefield of gotchas: service limitations, database throttling, misconfigurations, and more. As your application grows, you need a reliable method of finding what will break next.
Blue Matador finds the unknowns and notifies you about them in advance.
Zero configuration. Zero maintenance.
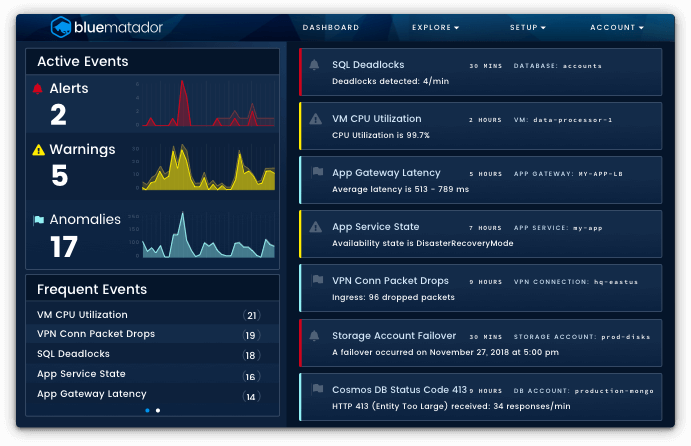
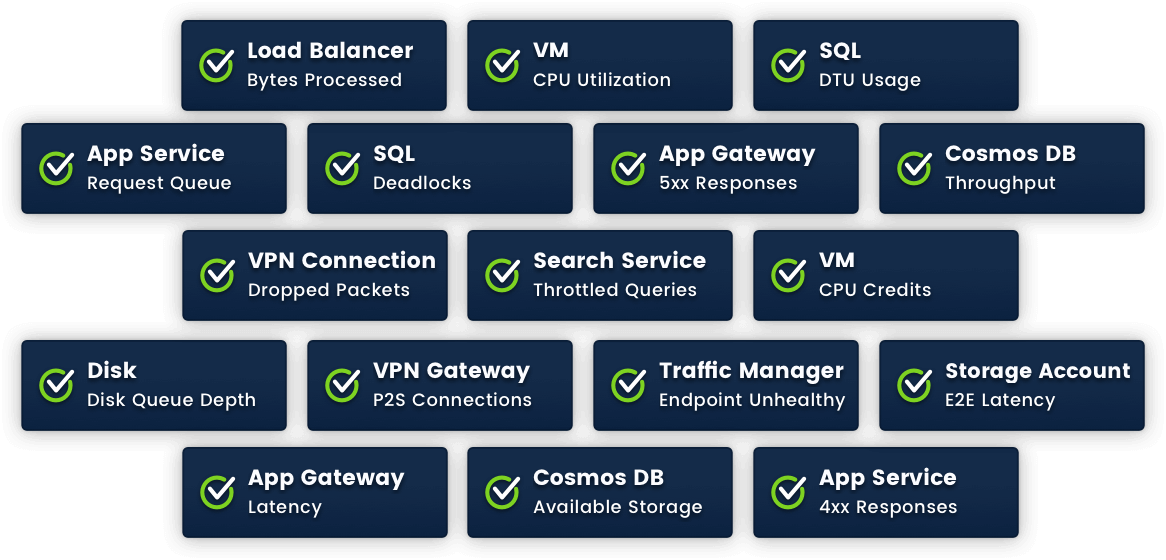
Nobody likes Azure Monitor alerts. They’re limited in scope, time-consuming to create, and costly to adequately monitor your infrastructure.
With Blue Matador, you’re done creating Azure Monitor alerts forever. All your alarms will be automatically created and maintained inside of our ML engine.
Reduce the overhead in spinning up new infrastructure — let Blue Matador do the monitoring for you. We detect new resources and create new monitors every time you:
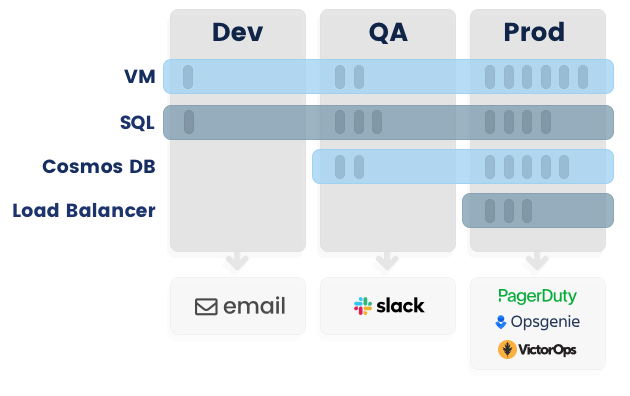
Use Azure resource groups, tags, or naming rules to split your resources by environment, team, SLA requirements, or any other arbitrary grouping. Resources can belong to multiple projects and vice-versa.
Select your project (environment, team, etc) on the dashboard, timeline, or other pages to limit scope to only that project’s resources and events.
Notification channels can be specific to projects, too. Send dev notifications to email and production alerts to PagerDuty.
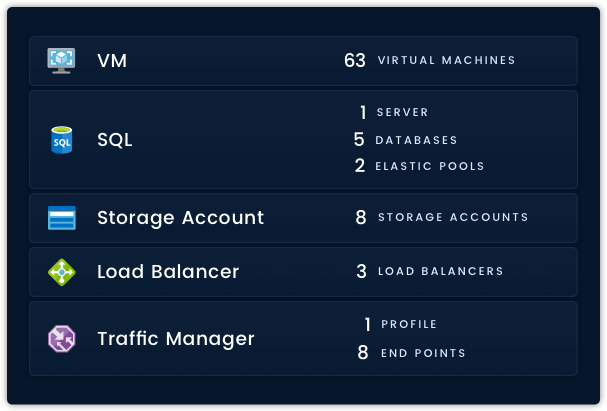
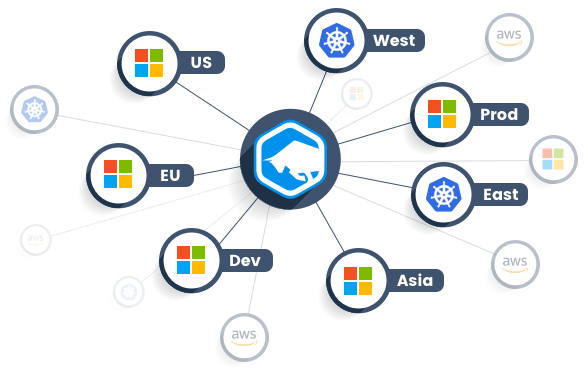
Hybrid environments are complex, but monitoring them doesn’t have to be. Our alert automation spans multiple public clouds and multiple accounts on the same cloud. With a single subscription, and on a single dashboard, you’ll be able to monitor:
With Azure Monitor, you decide which metrics to monitor, which alarms to create, and which thresholds to set. You pick the time intervals, the thresholds, and the aggregation function. If you miss anything, it’s your fault.
With Blue Matador, you focus on delighting your users. We do the heavy lifting on monitoring. We pick the thresholds, triage the issues, and guarantee the full coverage of all your Azure resources.
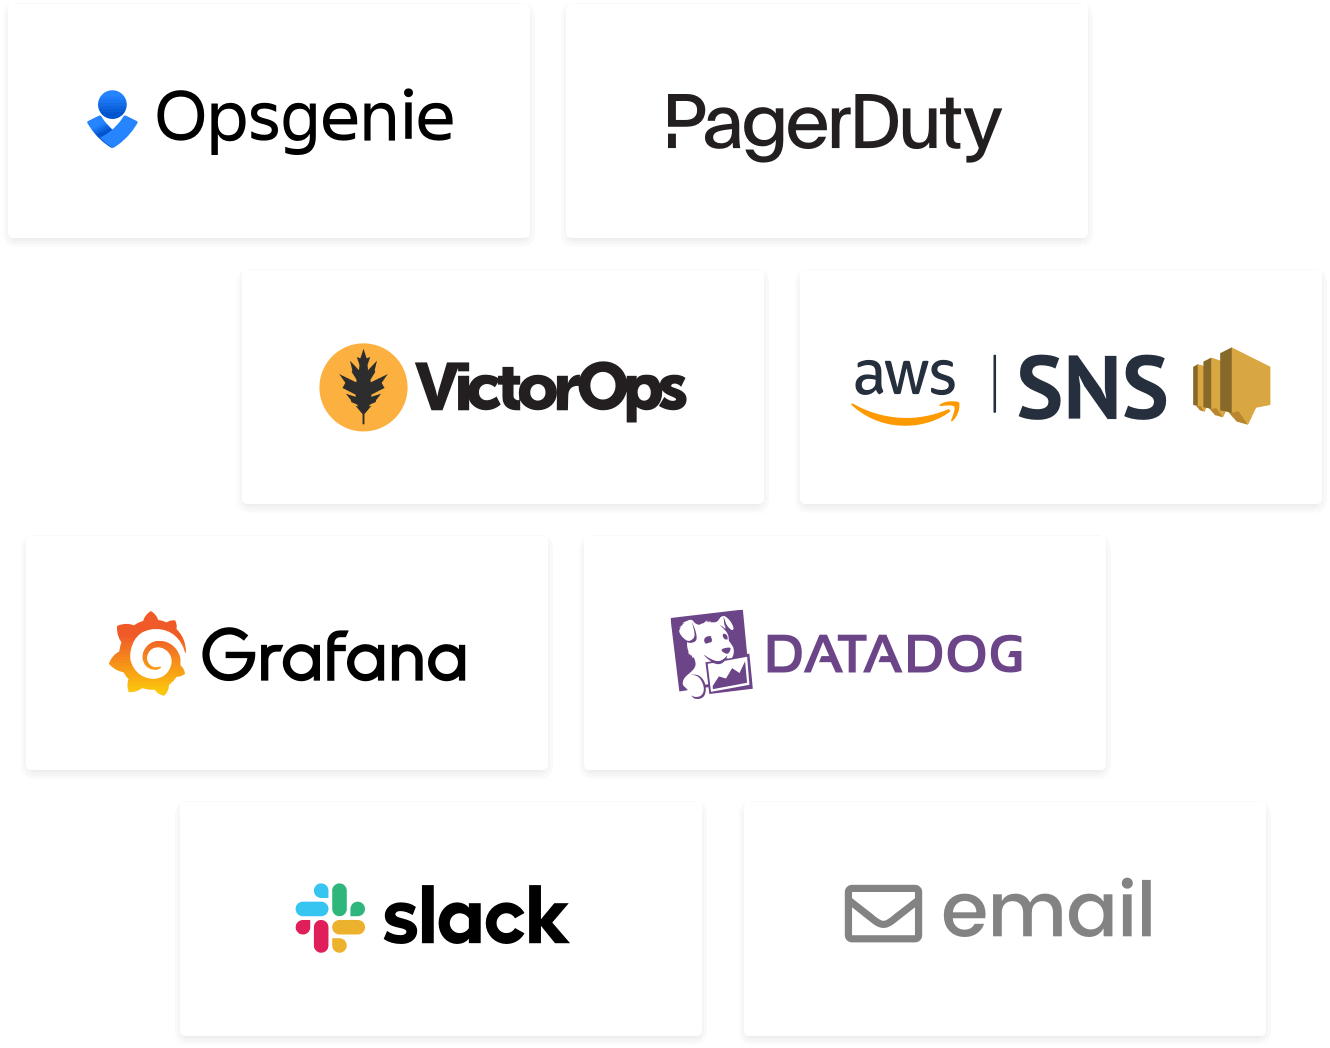
Keep using your favorite notification tools. Use Blue Matador to find new events, but keep using the tools you know and love to receive notifications. Our integrations are always first-class citizens and rely on API access, not email, to deliver notifications to you. Where supported, we also send an update for the “resolve” event.
“
Spencer Hess Cloud Operations Manager DirectScale
WHY BLUE MATADOR