
There’s a lot out there about Amazon CloudWatch already, but since Amazon’s default EC2 monitoring service pushes regular updates, most of what you’ll find will be dated (last updated: 4/29/2020). Let us know what you think about our take on CloudWatch 101. The plan is to get you up to speed in a hurry.
What is AWS CloudWatch?
Amazon CloudWatch monitors your Amazon Web Services (AWS) resources.
Essentially, CloudWatch is an archive built to store AWS metrics’ time series data. CloudWatch converts raw data feeds into digestible, actionable information. CloudWatch provides a set of predefined variables for free. The free tier also lets you graph and alert on these metrics.
Their paid service allows you to access, graph, and alert on additional metrics—including your own custom metrics—through the console, command line, or API. (The free tier limits you to console access only.) If you’re on AWS and haven’t taken detailed monitoring (paid version) out for a spin yet, it’s definitely worth the drive.
Want a faster, easier way to monitor AWS? See how Blue Matador works >
Recent AWS CloudWatch updates
Here are some of the latest features that CloudWatch has released:
- Contributor Insights - CloudWatch released this feature to public preview late in 2019, and it is now fully available as of April 2020. Contributor Insights are metrics from other users you can use to analyze log data, create time series, and glean other insights.
- CloudWatch Synthetics - A service that allows you to monitor your APIs and endpoints using canaries.
- ServiceLens - Integrates with AWS X-Ray to provide better visibility of your apps and services.
- Container Insights - Enables you to collect and analyze data from your containerized applications and services.
How does CloudWatch work?
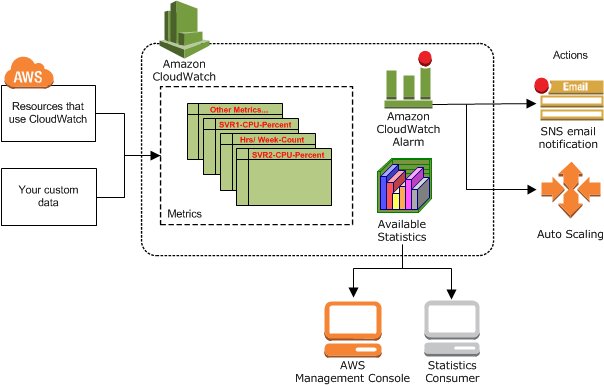
Amazon CloudWatch serves as a metrics repository for other AWS services. By default, EC2 pushes metrics to CloudWatch for later retrieval and real-time analysis. CloudWatch can also store and retrieve statistics passed from custom EC2 variables, other AWS services, and on-prem servers.
Here’s a visual representation of how CloudWatch operates within the larger AWS ecosystem. (This diagram is from the official CloudWatch User Guide).
Important CloudWatch terms
AWS Cloudwatch concepts are important to learn in order to feel comfortable reading CloudWatch documentation because much of it assumes that you’re already somewhat familiar with the product.
| Alarms | Metrics | |
| Statistic |
AWS CloudWatch metrics
Metrics are the most basic building block of CloudWatch. A metric is a variable that stores a time series data set. AWS services push metrics to CloudWatch. You can then get useful information about those metrics from CloudWatch.
Metrics:
- Are specific to a AWS region.
- Can’t be deleted.
- Expire after 15 months of no new data points.
- Are defined by a unique name/namespace/dimension combination.
CloudWatch retains:
- High-resolution metric data for 3 hours.
- Detailed standard metric data for 15 days.
- Basic standard metric data for 63 days.
Timestamps in CloudWatch
It’s hard to have a time series without a timestamp for each metric data point. CloudWatch allows for timestamps from two weeks in the past to two hours into the future. If you don’t send a timestamp dimension with your metric data points, CloudWatch creates a timestamp for you and sets it to the current time (UTC).
AWS CloudWatch namespaces
A namespace is a CloudWatch metrics container. Namespaces are useful if you want to avoid aggregating two different metrics with the same name. Every metric data point needs to be assigned to a namespace. CloudWatch won’t assign metrics to a default namespace for you. CloudWatch namespaces use AWS/service as their naming convention.
AWS CloudWatch alarms
Alarms are triggered based on a persistent state change for a specified period of time. CloudWatch can’t sound an alarm based on a particular state only.
Here’s more attributes that all alarms types have in common:
- CloudWatch Alarm Limits: 5,000 alarms per region per AWS account; one-day maximum monitoring period
- CloudWatch Alarm Properties: state:enabled,disabled; history (stored for two weeks)
- CloudWatch Alarm Access: list configured alarms; filter by state, time range
- CloudWatch Alarm Testing: temporary state change for a single alarm comparison period
Below are some important differences in alarm types.
Metric and composite CloudWatch alarms
Metric alarms trigger when a it detects a sustained change in state. Metric alarms watch only a single metric or the output of a math expression calculated with CloudWatch metrics.
Composite alarms can be configured to observe more than one metric and fire based on the state of each or a combination of metrics.
High-resolution CloudWatch alarms
A High-Resolution Alarm is tied to a high-resolution metric. Because high-resolution metrics update every second, High-Resolution Alarms can be triggered based on metric values within a ten-second period. For more information about high-resolution metrics, see AWS CloudWatch Configuration Guide: CloudWatch Custom Metrics.
Percentile-based CloudWatch alarms
By default, alarms rely on a sound statistical assessment of the metric being monitored. Percentile-base CloudWatch alarms address the challenge of monitoring a metric when there’s not enough data for a good statistical assessment.
Alarms and events get a more thorough treatment in Blue Matador's Amazon CloudWatch Monitoring Guide.
Dimensions in AWS CloudWatch
A dimension is metrics metadata in the form of a name/value pair. Metrics can have up to ten dimensions. When you set dimensions, AWS services send both data and metadata to CloudWatch.
Dimensions can be useful for filtering data and aggregating statistics. CloudWatch treats metrics across different namespaces as different metrics even if they have the same dimensions. (CloudWatch can’t aggregate across a custom metric dimensions.)
Percentiles in AWS CloudWatch
Percentiles are useful in identifying outliers and periods of high demand. A standard approach for finding outliers is to look for data points three standard deviations from a metric’s average. Persistent metric data points above the 95th percentile points to a period of high use, regardless of what resource utilization looks like.
You can use percentiles with the following AWS services:
- Amazon EC2
- Amazon RDS
- Kinesis
- Application Load Balancer
- Elastic Load Balancing
- API Gateway
There are some limits to percentile statistics. You can’t aggregate statistics if any metric data point in the time series has a negative value. Also, percentiles don’t work on data sets pushed to CloudWatch.
Statistics in AWS CloudWatch
Statistics aggregate time series data points across a specified time period. Available statistics include: minimum, maximum, sum, average, count, and percentile. You can also push your own statistics to CloudWatch.
The default period is either 5 minutes or 1 minute, depending on whether detailed monitoring is enabled and what service you are talking about. All statistical time period requests use seconds as the unit of time. The default time range is the last hour.
If you’re getting two statistics for metrics with the same name, namespace and dimension(s), you might want to check to make sure your units are the same across all metric data points. (If you don’t set units for custom metrics, CloudWatch sets the unit value to “None”.)
| Creating CloudWatch alarms, setting thresholds, and updating CloudWatch every time you scale is cumbersome and frustrating. Blue Matador monitors hundreds of AWS metrics out of the box, no configuration required. Try it free > |


