
![]() Amazon RDS allows you to store your application data in databases without having to actually manage the servers the databases are hosted on. It also allows you to easily set up read replicas and take snapshots of your database. However, since it’s a managed service, you have less visibility with traditional monitoring tools. As such, it becomes even more important to take advantage of the available monitoring tools in AWS. In this post, we’ll explain how to use CloudWatch and what is important to watch.
Amazon RDS allows you to store your application data in databases without having to actually manage the servers the databases are hosted on. It also allows you to easily set up read replicas and take snapshots of your database. However, since it’s a managed service, you have less visibility with traditional monitoring tools. As such, it becomes even more important to take advantage of the available monitoring tools in AWS. In this post, we’ll explain how to use CloudWatch and what is important to watch.
How to Use CloudWatch Metrics with RDS
RDS publishes a host of metrics to CloudWatch and looking for abnormalities and limits in these metrics is a great way to spot issues with your databases. However, some metrics are better indicators of database health than others. In this section, we’ll discuss the metrics to monitor.
FreeableMemory
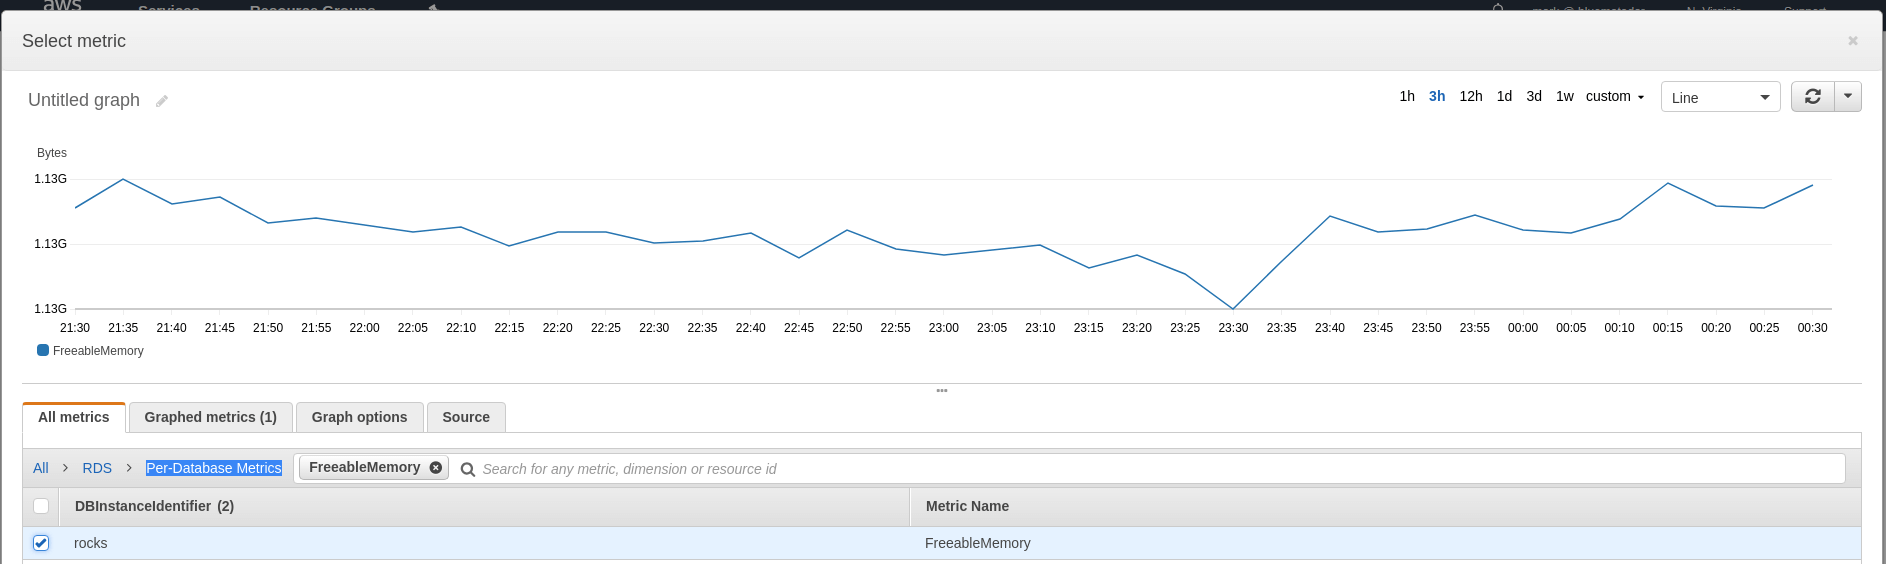
RDS’s FreeableMemory metric refers to the amount of unused memory on a database instance. When this metric gets low, the OS of the database instance may begin to start swapping memory in and out of swap space. This will result in significantly slower reads and make your database unable to respond to requests.
To monitor FreeableMemory you should create a CloudWatch alarm on the metric’s Average aggregation that fires when you go below 100MB of free memory.
DatabaseConnections
RDS’s DatabaseConnections metric measures the number of connections to your database instance. An anomalous number of connections can hint at unexpected behaviour in your application. More importantly, reaching the maximum number of connections for your database can also cause new connections to be rejected.
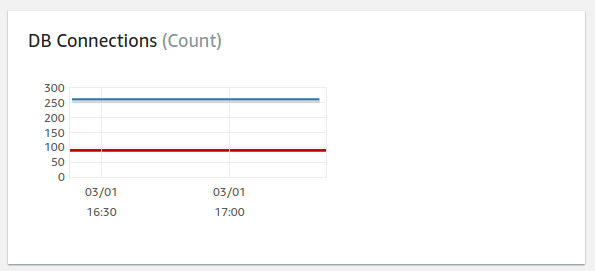
# Connections vs Max # Connections
Because the number of collections allowed depends on the size of your db instance type, to monitor DatabaseConnections you should first determine the maximum number of connections for your database. Then create a CloudWatch alarm to alert you when you go over 95% of that value for the Average aggregation.
Deadlocks (Aurora Only)
If you are using the Amazon Aurora database engine, you’ll have access to the Deadlocks metric. A deadlock occurs when two or more transactions hold locks that each other require. Deadlocks are resolved by aborting one of the transactions and allowing the others to complete, which may have an adverse effect on your application. If you have consistent deadlocks, you will need to examine the queries you’re making to find the source of the deadlocks.
To monitor Deadlocks, just create a CloudWatch alarm on the Sum aggregation that alerts you when there are any deadlocks in your database. To avoid being too spammy, you’ll want to configure the alert to only fire when at least 5 consecutive datapoints are greater than 0 (that is, it’s happening consistently for 5 minutes).
ReplicaLag
RDS’s ReplicaLag metric measures the number of seconds a replica is behind the primary instance. If your replica gets too far behind the primary and the primary experiences a failure, your replica will be missing data that was in the primary instance.
To monitor ReplicaLag, create a CloudWatch alarm on the Maximum aggregation to alert you when your replica gets to far behind. You’ll need to decide how much lag is acceptable for your application, but we recommend no more than 30 seconds. Like Deadlocks, you’ll want this alert to only fire after at least 5 consecutive datapoints are over the threshold to avoid alert fatigue for temporary spikes.
Other Metrics to Watch for Anomalies
For the remaining RDS metrics we recommend you watch, you’ll be looking for anomalies. Because CloudWatch doesn’t support anomaly detection, you’ll have to use averages to find issues. To do so, you’ll want to look at a week of data for each metric and then determine the average high and low. Add 10% to either side of the metric and you have a good window of what looks healthy for your application. We recommend that you create CloudWatch alarms for each of these metrics on their Average aggregations, but send lower priority notifications. Unless the values are really far off from normal, you probably won’t want to wake up in the middle of the night, as these anomalies are most useful for correlating with other issues in your system. You’ll also want to make sure the alarms only go off when there have been 5 consecutive anomalous datapoints.
NetworkReceiveThroughput & NetworkTransmitThroughput
NetworkReceiveThroughput and NetworkTransmitThroughput refer to the number of bytes sent to and from your database, respectively. A sharp spike or drop in either metric could signal that your application is querying your database in an unexpected way.
ReadThroughput & WriteThroughput
ReadThroughput and WriteThroughput are similar to the network IO metrics except for disk IO. A spike in reads could signal a RDS taking a snapshot, and a spike in writes could hint at expensive table modifications.
CPUUtilization
CPUUtilization tracks the percent of CPU the database instance is using. While an excellent indicator of an overworked database, it tends to fluctuate a lot and can lead to noisy alerts. The key to CPUUtilization is to look for sustained high CPU.
SelectLatency, SelectThroughput, CommitLatency, & CommitThroughput
These Aurora only metrics measure the latency for your queries as well as the actual operation counts. Keeping an eye on these metrics can help you correlate issues you may see in your application.
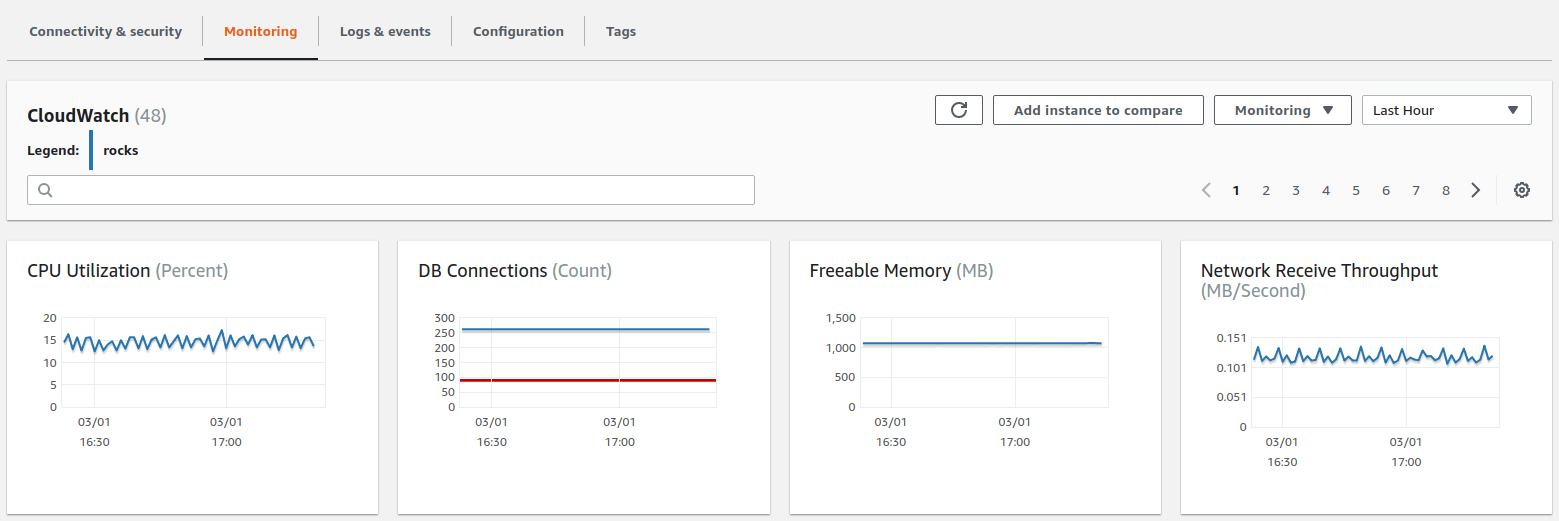
How to View CloudWatch Metrics
CloudWatch metrics for RDS can be viewed normally through the Metrics portion of CloudWatch, but it is also possible to use the Monitoring tab in the RDS console. This tab shows several metric graphs for each database.
How to Create CloudWatch Alarms for RDS
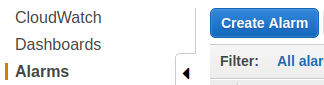
Now that we’ve determined which metrics to monitor, let’s talk about how to create CloudWatch alarms on those metrics. CloudWatch alarms are created from the CloudWatch console.
-
Click on Create Alarm.
-
Click on Select Metric and type the name of the metric into the search box.
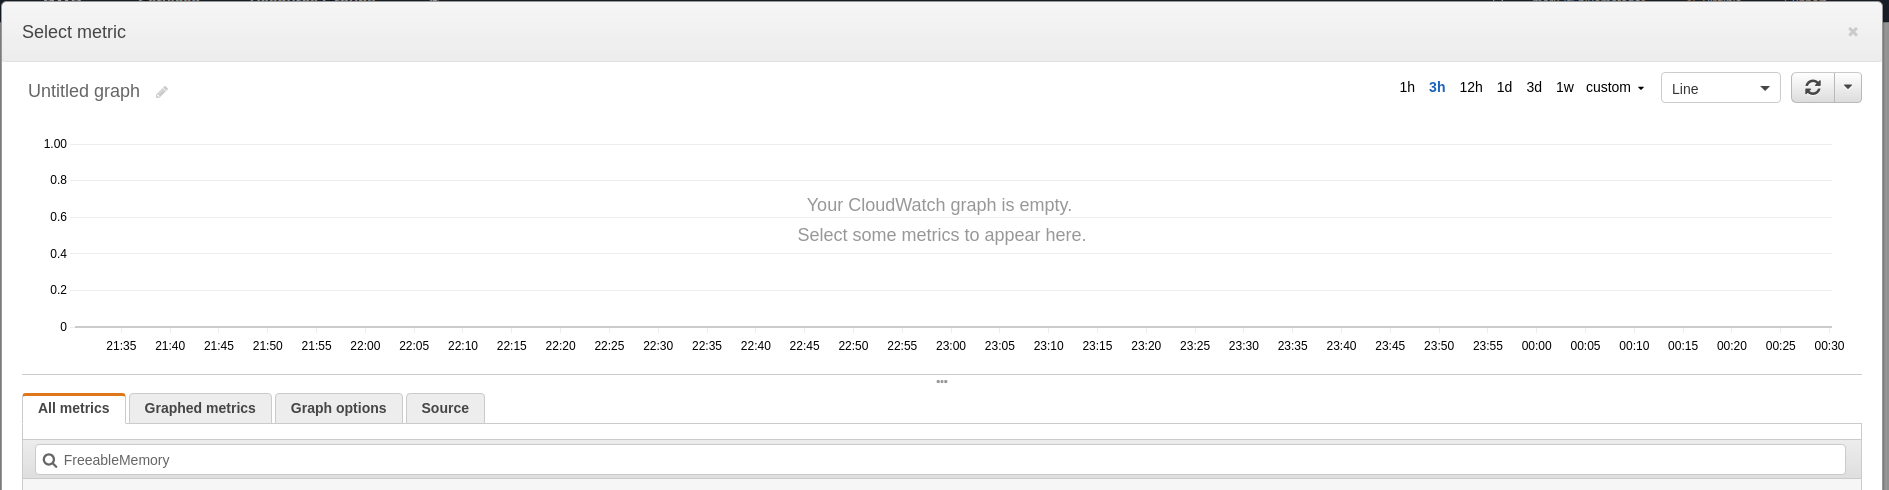
-
Choose the metric for the database you’re going to monitor (which you can find in the tile labeled Per-Database Metrics) and look at a 1 week graph to determine what your baselines are. Click Select Metric.
-
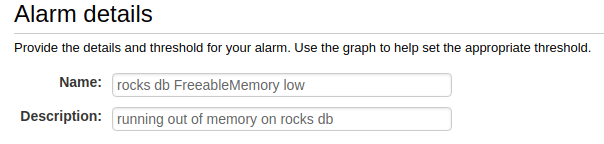
Name and describe your alarm.
-
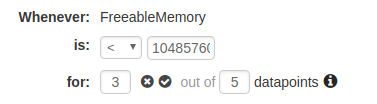
Configure your thresholds. You can use the thresholds described earlier in this article for each metric.
-
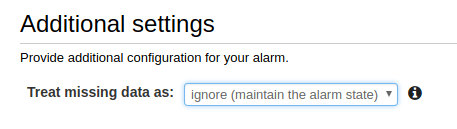
Choose what to do when data is missing (we recommend ignoring missing data and just keeping the previous state to keep alerts from flapping).
-
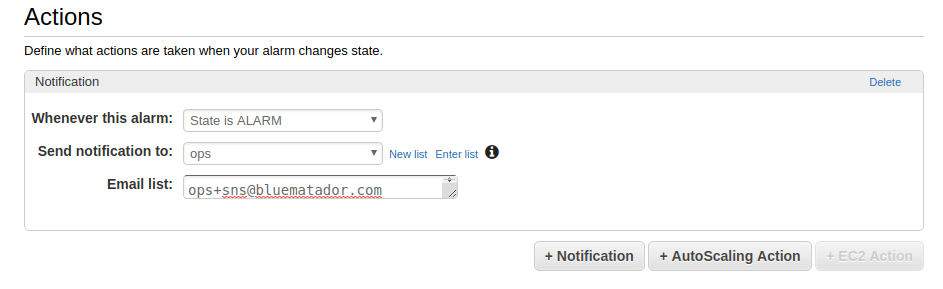
Set up notifications for the alarm.
-
Click Create Alarm.
Unfortunately, since your databases likely have different baselines, you’ll have to repeat the whole process for each database and metric combination. This can get incredibly time consuming and tedious.
Next Steps
Now you know how to monitor Amazon RDS using CloudWatch. However, it can be error prone and tedious to set up CloudWatch monitoring for all your databases (and remembering to do it for databases you create in the future is tough!). Take the manual work out of monitoring your RDS databases and use Blue Matador’s automatic setup to effortlessly watch for anomalies and errors within Amazon RDS without any configuration. It also watches the InstanceState and RDS events of your databases. Get started on automatic alerting with Blue Matador now!


