
![]()
AWS Lambda is one of AWS’s most popular cloud services. It allows serverless applications to be built by dividing up an application into functions that can be triggered by changes in your system. Since they are critical to the health of your application, properly monitoring Lambda functions is a top priority for most teams. In this blog post, we will go over how Blue Matador monitors Lambda functions automatically and without configuration. We will cover the following topics:
- How Blue Matador is Different
- Integrating Blue Matador with AWS Lambda
- Monitoring Lambda Cost
- Monitoring Lambda Health
- Correlating Lambda Events
How Blue Matador is Different
Blue Matador approaches monitoring differently from other monitoring tools. We want to reduce the toil in monitoring, help you surface critical production issues, and be proactive instead of reactive with your monitoring, all without the large up-front and ongoing maintenance required by other tools.
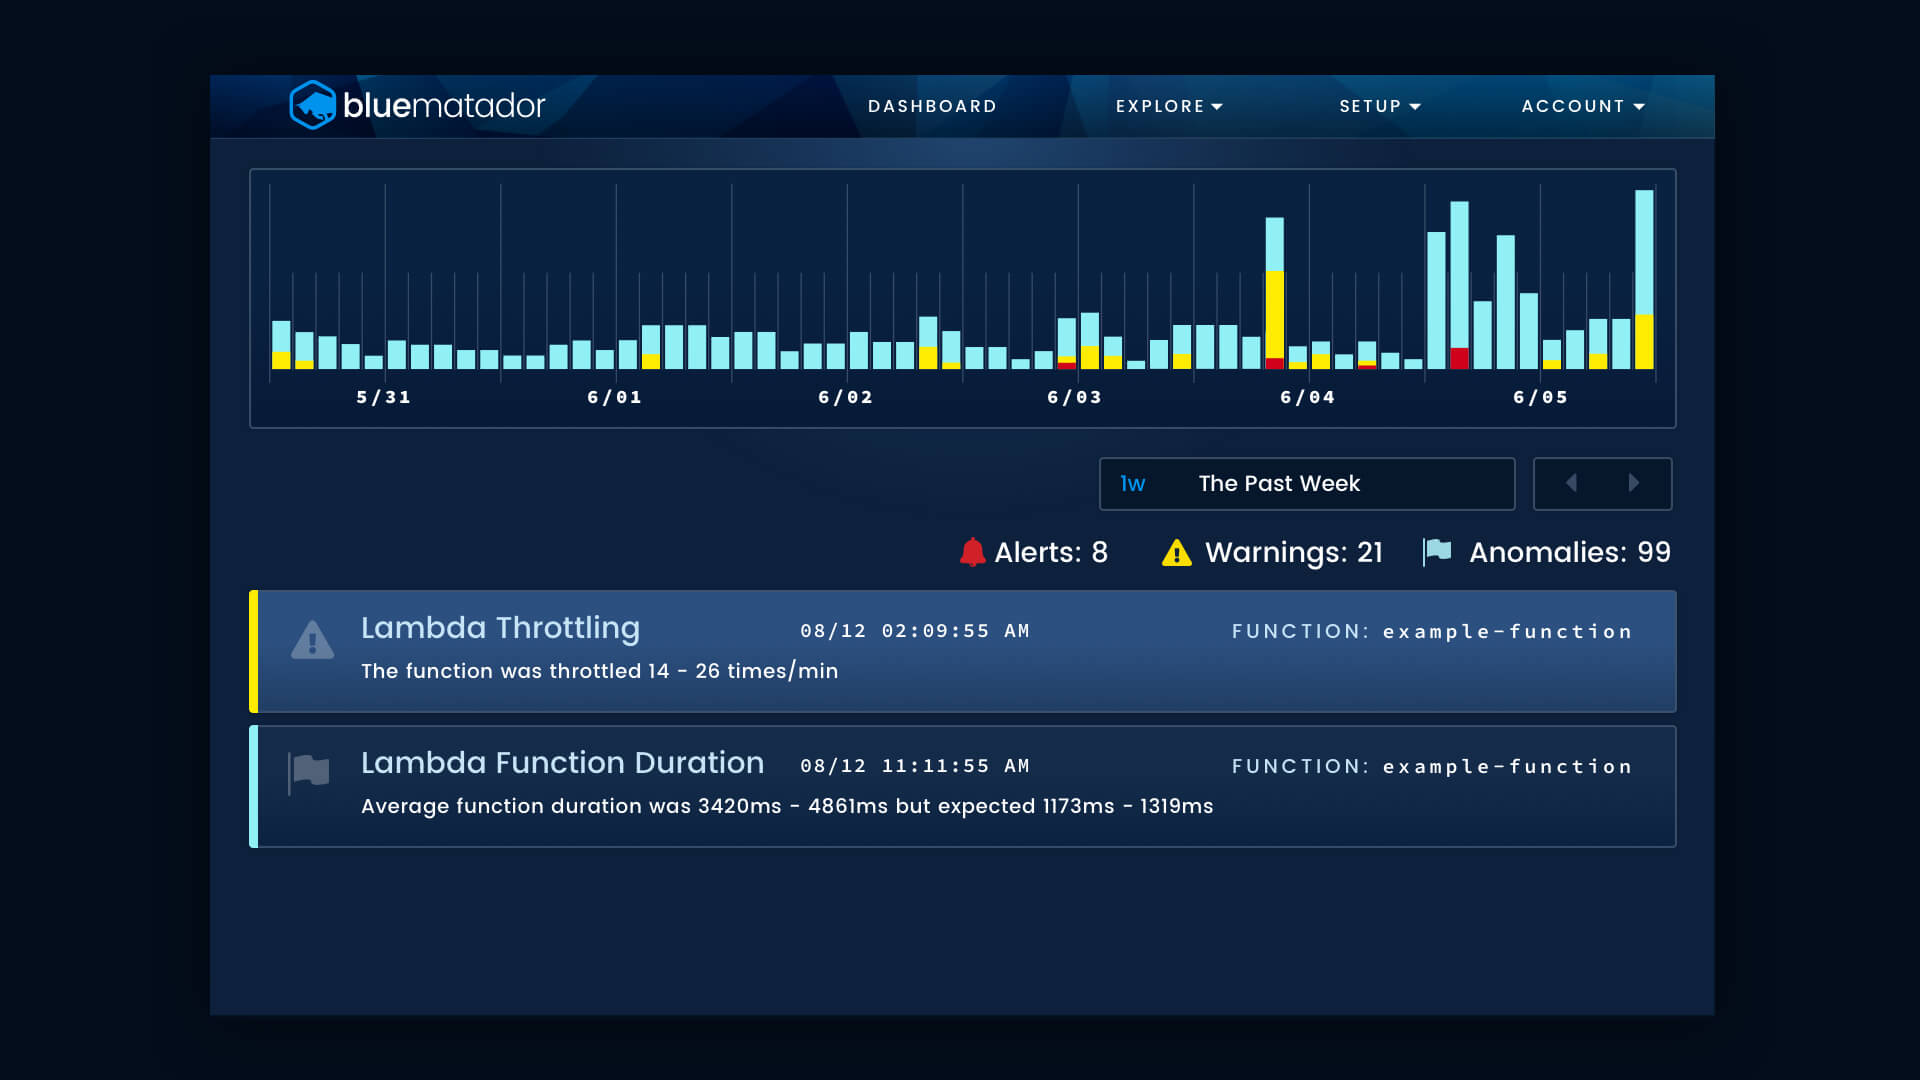
In addition, Blue Matador automatically creates events using machine learning with a dash of heuristics so you know when something requires your attention. These events are automatically categorized as Alerts, Warnings, and Anomalies to reflect the severity of the event.
Integrating Blue Matador with AWS Lambda
AWS Lambda is one of the AWS services that are automatically monitored by Blue Matador when your AWS integration is set up. Creating an AWS integration with Blue Matador is extremely simple and requires just an IAM user or IAM role with read-only access to your AWS account. A full guide for setting up your AWS integration with Blue Matador can be found here.
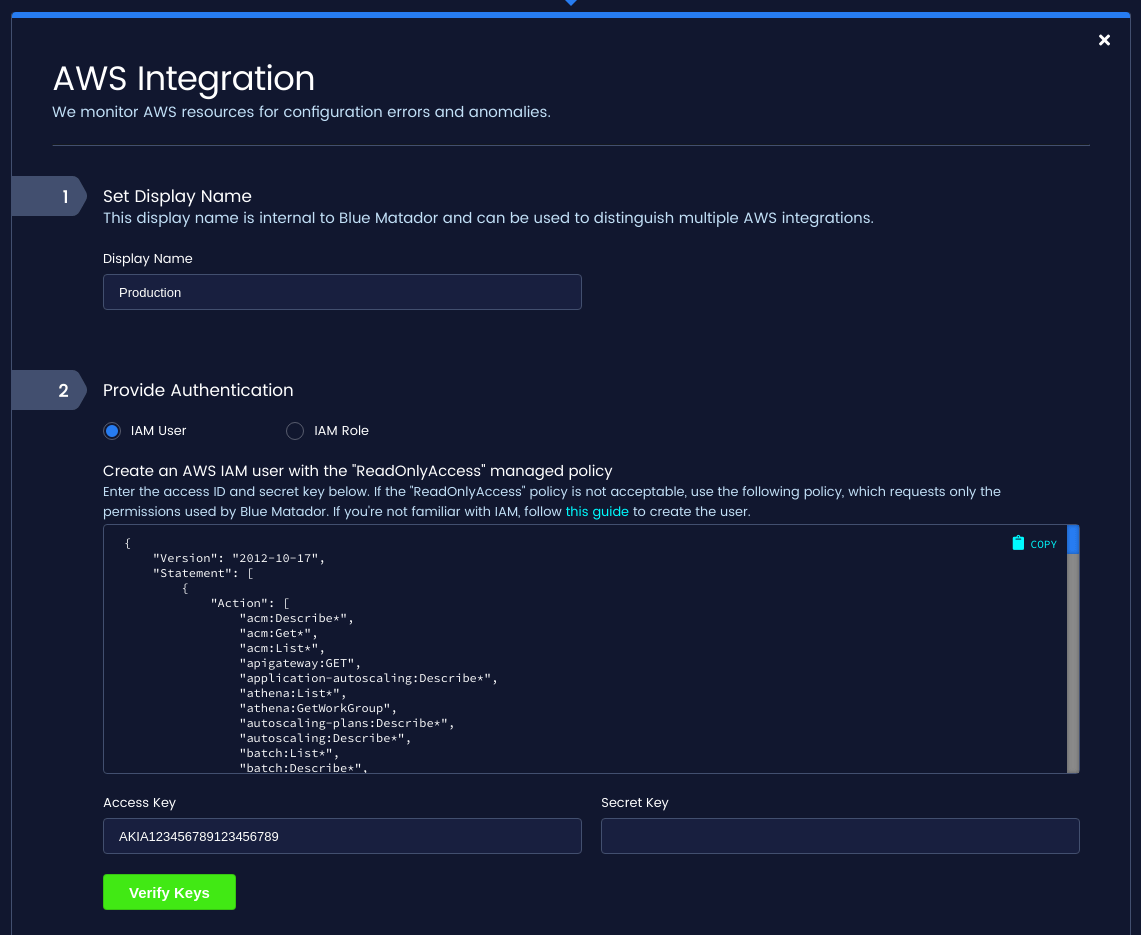
Once your AWS integration is created, Blue Matador will begin immediately collecting metadata and metrics for all of your Lambda functions. The Lambda API is used to list your functions in each AWS region. CloudWatch metrics are then gathered for each function in each region of your AWS account, which are then fed into our metric pipeline. Blue Matador collects metrics for Lambda on a 5-minute interval. This is done to balance getting up-to-date metadata and metrics with the fact that both CloudWatch and Amazon Lambda rate-limit requests.
Monitoring Lambda Cost
One of the difficult things about AWS Lambda is reasoning about infrastructure cost. Cost is a combination of the memory you allocate to a function, how long it runs, and how many times it’s invoked. Blue Matador helps you keep costs in check by looking for anomalies in the following metrics:
Invocations are the number of times that your Lambda function is run. If this metric spikes, so will your Lambda costs. In addition, this metric is useful for determining system health, as spikes or drops in the number of function invocations often denote problems in the upstream system that triggers the function.
Duration measures the average time it takes for your function to execute. If duration increases, your Lambda cost will as well. This metric also helps you determine the health of your function, as higher latency is likely due to issues in the function code.

Monitoring Lambda Health
Blue Matador monitors the following situations to help you keep up on the health of your Lambda functions.
Errors is the number of times Lambda reports a function invocation that terminates in an error state. Because of the distributed nature of Lambda, some number of errors are expected, so Blue Matador applies anomaly detection to the number of errors.
Iterator Age is the age of the last record processed for stream based functions. Blue Matador detects if this metric increases so you can avoid getting behind in the stream. Getting too far behind can eventually lead to data loss as old data exceeds the retention limit and is discarded.
Throttling occurs when your functions are invoked quickly enough to exceed your concurrency limit. When this occurs, your function will not execute and the triggering payload will be discarded (except for stream based functions, which will be retried). Check out our blog post on Lambda throttling for more information.

Dead Letter Errors measures the number of times a function fails and its payload cannot be written to a configured Dead Letter Queue.
Blue Matador also detects when your function duration is approaching the configured Timeout. This can occur for the same reasons as Duration, but can also just slowly creep up as a function is expanded. In those cases, you may just have to reconfigure your timeout.
Correlating Lambda Events
Lambda events can easily be correlated with the other events generated by Blue Matador by using the Timeline. The Timeline page shows all of the events in your account in chronological order. Events are enriched with metadata, assigned a severity of Alert, Warning, or Anomaly, and can be filtered by any property on the event.
With all your events viewable in a single pane, you can correlate your Lambda issues to DynamoDB, API Gateway, or any other events to quickly perform root cause analysis.
Conclusion
We’ve gone over how to set up Blue Matador to monitor your Lambda Functions, what kinds of events Blue Matador automatically configures and maintains, and how these events can be used to troubleshoot your entire system.
In addition to our automated alerts for Lambda, Blue Matador automatically creates alerts for other AWS services like ELB, RDS, EC2, and more. In fact, Blue Matador has hundreds of alerts for AWS and Kubernetes that are automatically set up and dynamically maintained taking the time and toil out of monitoring.


