
Although AWS sometimes feels like magic, it’s just software that controls capacity and allocation on their previously provisioned hardware. RDS is one of the services that can feel especially magic, because of the general difficulty and drudgery required to set up and manage a production database. In a matter of minutes, anyone can have a production database, complete with replication, automatic failover, backup schedules, and point-in-time recovery.
Because they feel so magic, many users are inclined to think their RDS clusters need no maintenance, scale endlessly, and never have problems. This will be the downfall of your application. To avoid it, you need to proactively monitor the health of your cluster, number of connections, resource consumption, upgrades, and deadlocks. It’s those deadlocks I’d like to focus on in this blog.
What are RDS deadlocks?
The first part of setting up RDS is picking your database engine. There are six options: Aurora (Amazon’s cloud-first, MySQL-compatible engine), MySQL, MariaDB (MySQL variant), PostgreSQL, Oracle, and Microsoft SQL Server. RDS is nothing more than a set of management options over that engine, like backup schedules, EC2 instance, AZ options, etc.
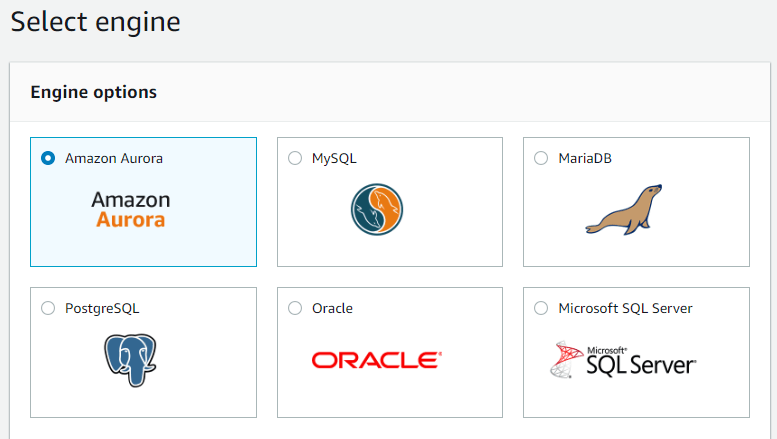
Screenshot of RDS database engine options, taken from the AWS console
Because it’s a thin layer, RDS doesn’t actually have any deadlocks, per se; the underlying engine has deadlocks, and RDS reports on them.
Relational databases follow the principles of ACID: Atomicity, Consistency, Isolation, and Durability. To accomplish atomicity, every one of these engines supports transactions. A transaction is a way to guarantee either all of your queries finished or none of them did. Every engine accomplishes this with row, table, or database locks. It’s these locks, combined with your application’s queries, that introduce the potential for deadlocks.
Deadlock occurs when there are multiple database connections running queries on the same set of data and the following happens. The first thread locks row X, then the second thread locks row Y, then the first thread tries to lock row Y and waits, then the second thread tries to lock row X and waits. This is classic deadlock in RDS. This image pulled from the web illustrates the simple case of deadlock.
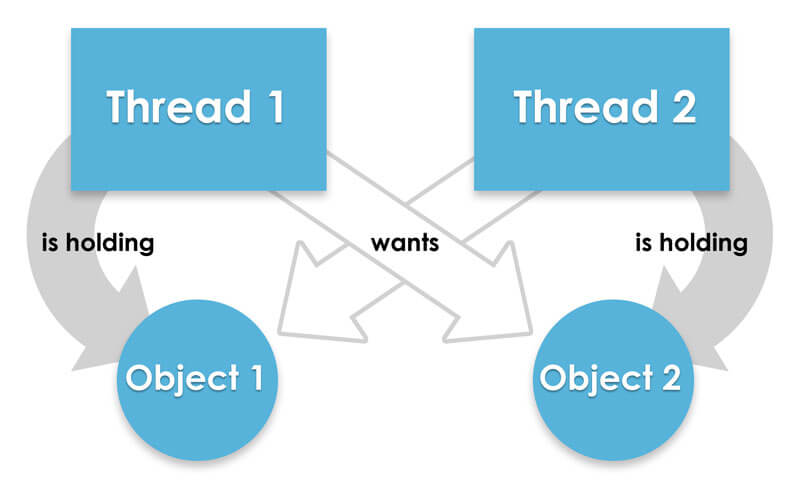
Deadlock is when two or more threads hold their own resources and want more. Taken from https://docs.fusion-reactor.com/display/FR60/FusionReactor+Deadlock+Plugin
The simple explanation above does not cover all cases of deadlock. For example, the connections could get read locks instead of write locks. This would still cause a deadlock. Similarly, they could be table locks instead of row locks — still deadlock. It could include hundreds of connections and thousands of rows. If you find this type of deadlock happening, definitely take a vacation after fixing it, you earned it.
The real problem with deadlocks is that, without any intervention, all threads involved would be stuck indefinitely waiting for their resources. This would cripple any size system very quickly. To combat this problem, each engine listed above monitors and “corrects” deadlocks. The correction usually comes in the form of aborting transactions. So, some of your threads will get an exception/error, which can be logged to a log file, and other threads will continue like nothing ever happened.
Deadlocks in Aurora
One of these engines is not like the others. Amazon’s Aurora database engine is marketed as a “cloud-first” database. It is cluster-aware, AZ-aware, and durability-aware. Despite its differences, Aurora is capable of deadlocks, too.
Under the hood, Aurora is just a proprietary version of MySQL from 2013. It uses the InnoDB engine, which supports transactions and deadlocks.
Does DynamoDB have deadlocks?
Nope. Dynamo is a proprietary NoSQL database which fails the ACID test (intentionally). No thread can get two locks at the same time, so no deadlock can ever occur. The same goes for most other AWS data stores including S3, EFS, ElastiCache, and Neptune. Redshift, on the other hand, is another relational database with transactions and is susceptible to deadlocks.
Where do I find deadlocks in RDS?
For good reason, they’re hard to get to. Not that they’re hidden, they’re just mixed in with up to 41 other metrics reported by RDS. The actual list of metrics depends on which type of database you’re running. Aurora has the most at 42 metrics.
To find these metrics, login to the AWS console, navigate to the RDS service, select one of your RDS instances, click on the Monitoring tab, and then go through each page of 6 graphs until you find the one labeled “Deadlocks”. It should look like this:

Graph of deadlocks for an RDS cluster
At the top of the post, I recommended you proactively monitor RDS for deadlocks. This is the point at which you should do that. For each of your production-critical databases, create a CloudWatch alert to notify you when they happen. They’re probably not worth waking up in the middle of the night, but the sooner you can address them, the better. Once they start compounding and mixing together, they can take weeks to untangle.
If you don’t feel like making all those alerts, messing with the thresholds, and worrying about monitoring future instances, Blue Matador’s automated alerting can do it for you. Out of the box, we automatically alert on hundreds of events including RDS deadlocks. It will save you weeks of time setting up and configuring thresholds as well as reducing your worry about alert coverage.


