
![]() If you’re using AWS Kinesis in your application, you’ll want to monitor your Kinesis streams to make sure they are healthy and that your producers and consumers are interacting with them correctly.
If you’re using AWS Kinesis in your application, you’ll want to monitor your Kinesis streams to make sure they are healthy and that your producers and consumers are interacting with them correctly.
CloudWatch exposes many metrics that can help you determine the health of your Kinesis streams, but it can be a pain to set up. In this post, we’ll discuss the metrics that are most helpful, how to get CloudWatch up and monitoring your Kinesis streams, plus an easier alternative.

AWS Kinesis monitoring with CloudWatch: basic vs. enhanced
CloudWatch can provide two levels of metric granularity, basic and enhanced. By default, a Kinesis stream has basic-level granularity enabled, which means CloudWatch will collect metrics for the stream as a whole and not for individual shards that make up the stream.
To get shard-level metrics, you will need to use the EnableEnhancedMonitoring API to turn on enhanced granularity for a stream. Using this API, you can select which metrics you’d like to enable enhanced monitoring for your stream.
You can enable enhanced monitoring for the following metrics:
- IncomingBytes
- IncomingRecords
- OutgoingBytes
- OutgoingRecords
- WriteProvisionedThroughputExceeded
- ReadProvisionedThroughputExceeded
- IteratorAgeMilliseconds
You can also access enhanced monitoring through the Kinesis stream UI. To do so, select your stream from the list of streams in the Kinesis console and expand the section labeled Shard level metrics.
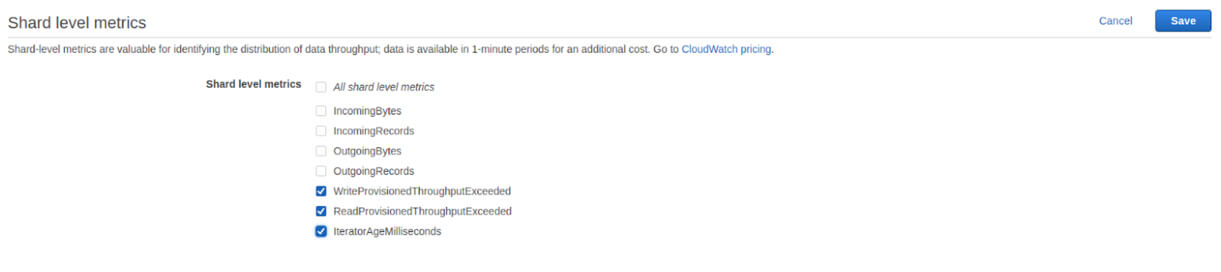
Just check the metrics you’d like to enable.
Why Enable Enhanced Monitoring?
Enhanced monitoring is useful for determining when your shards are not being evenly utilized. If any shards deviate significantly from the average, you should assess the evenness of your partition key’s distribution. Even if your partition keys are designed to be evenly distributed, there are times when you can have “hot” or “cold” shards. In these cases, you should split over-utilized shards and merge under-utilized shards.
Why Shouldn’t I Always Enable Enhanced Monitoring?
Basic level monitoring is included for free with Kinesis, but each metric you enable will be charged as a custom metric in CloudWatch. Each stream has 7 metrics that can be enabled, meaning each stream could cost $2.10/mo to monitor with enhanced monitoring. If you enabled enhanced monitoring on all metrics for all your streams it can get expensive quickly, especially if you aren’t using the data.
How to use CloudWatch metrics with Kinesis
CloudWatch exposes many Kinesis metrics, but some a more useful than others. Here are the ones you should be watching:
GetRecords.IteratorAgeMilliseconds
GetRecords.IteratorAgeMilliseconds measures the difference between the age of the last record consumed and the latest record put to the stream. This metric is particularly important to monitor because having too high of an iterator age in relation to your stream’s retention period can cause you to lose data as records expire from the stream. AWS recommends that this value should never exceed 50% of your stream retention; when you get to 100% of your stream retention, data will be lost. Monitor the Maximum stat to make sure none of your shards ever approach this limit.
If you are getting behind, a temporary stopgap is to increase the retention time of your stream; the real solution is to add more consumers to keep up with the rate at which data is being put to your stream.
ReadProvisionedThroughputExceeded
When your consumers exceed your provisioned read throughput (determined by the number of shards you have), they will be throttled and you won’t be able to read from the stream. This can start backing up your stream. To determine if this is the case, monitor the Average statistic for ReadProvisionedThroughputExceeded and try to get this value as close to 0 as possible.
If you find that you are being consistently throttled, you will have to add more shards to your stream to increase your provisioned read throughput. If adding more shards doesn’t lower the number of throttles, you may have a “hot” shard that is being read from more than others. Enable enhanced monitoring, find the “hot” shard, and split it.
WriteProvisionedThroughputExceeded
When your producers exceed your provisioned write throughput (determined by the number of shards you have), they will be throttled and you won’t be able to put records to the stream. Monitoring the Average stat for WriteProvisionedThroughputExceeded will help you to determine if your producers are healthy.
To fix consistent throttling, you will have to add shards to your stream. This will raise your provisioned write throughput and keep you from being throttled in the future.
PutRecord.Success, PutRecords.Success
PutRecord.Success and PutRecords.Success are incremented whenever your producers succeed to send data to your stream. Monitoring for spikes or drops can help you monitor the health of your producers and help you catch problems early. You’ll want to watch the Average statistic for whichever of the two API calls you use (because CloudWatch splits the two APIs into two different metrics).
GetRecords.Success
GetRecords.Success is the consumer-side corollary to PutRecords.Success. As such, looking for spikes or drops in this metric will allow you to ensure your consumers are healthy and let you catch problems early. Average is the most useful statistic for this purpose.
Average, minimum, and maximum stats in Kinesis
When using the Kinesis metrics in CloudWatch, you’ll need to be aware that some statistics do not behave in an intuitive way. In some cases, the Average, Minimum, and Maximum stats for a metric will apply to only individual API calls, rather than values across the stream at that point in time.
Take, for example, the Average stat for IncomingRecords. Rather than getting the average number of records put to the stream for a time period, you would get the average size of the batches of records sent to the Kinesis stream.
Similarly, Minimum would return the smallest batch size, and Maximum would return the largest. This applies to the following list of metrics:
- GetRecords.Bytes
- GetRecords.Records
- IncomingBytes
- IncomingRecords
- SubscribeToShardEvent.Bytes
- SubscribeToShardEvent.Records
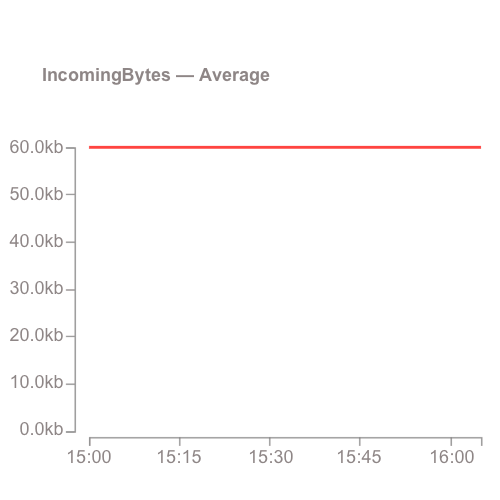
You’re not sending 60kb per minute, you’re sending 60kb per PutRecord request!
Alternatives to CloudWatch
Now you know how to monitor Kinesis using CloudWatch. However, it can be error prone to set up CloudWatch monitoring for all your streams (and remembering to do it for streams you create in the future is tough!).
Automated monitoring with Blue Matador
Take the manual work out of monitoring your Kinesis streams and use Blue Matador’s automatic setup to effortlessly watch for anomalies and errors with Kinesis. Blue Matador will monitor all your streams automatically, even the new ones. We also monitor dozens of other AWS services as well as Azure and Kubernetes.


