
Kubernetes is the defacto solution for production-ready container orchestration in 2020. Organizations of any size can take advantage of Kubernetes’ quick setup, feature-rich API, and growing community to deliver value quickly and at scale. Since Kubernetes is central to many infrastructures, properly monitoring your Kubernetes clusters is critical. In this post, we will go over how Blue Matador monitors each piece of your Kubernetes cluster automatically.
How Blue Matador Is Different
Blue Matador approaches monitoring differently from other monitoring tools. It takes next to no time to set up, because all our alerts are automated. We want to reduce the toil in monitoring, help you surface critical production issues, and be proactive instead of reactive with your monitoring, all without the large up-front and ongoing maintenance required by other tools.
Blue Matador detects Kubernetes events using machine learning with a dash of heuristics so you know when something requires your attention. Blue Matador automatically triages these events and designates them as Alerts, Warnings, and Anomalies to reflect the severity of the event. Plus, you can easily correlate events across your entire system. Blue Matador also monitors AWS and Azure, giving you further insights into your infrastructure beyond Kubernetes.
Learn more about Blue Matador Kubernetes monitoring >
Integrating Kubernetes with Blue Matador
Kubernetes monitoring functions similarly to many other DevOps tools that integrate with Kubernetes. Blue Matador runs a lightweight agent (written in golang!) as a DaemonSet in your cluster. This agent has basic permissions granted via RBAC that give read-only access to the Kubernetes API. Using the Kubernetes API and read-only access to a few filesystems on the host (/proc and /sys/fs/cgroup for the Linux-savvy) our agent collects metadata and metrics for your Kubernetes Nodes, Controllers, Pods, and Events. Complete setup with a few kubectl commands in just a few minutes.
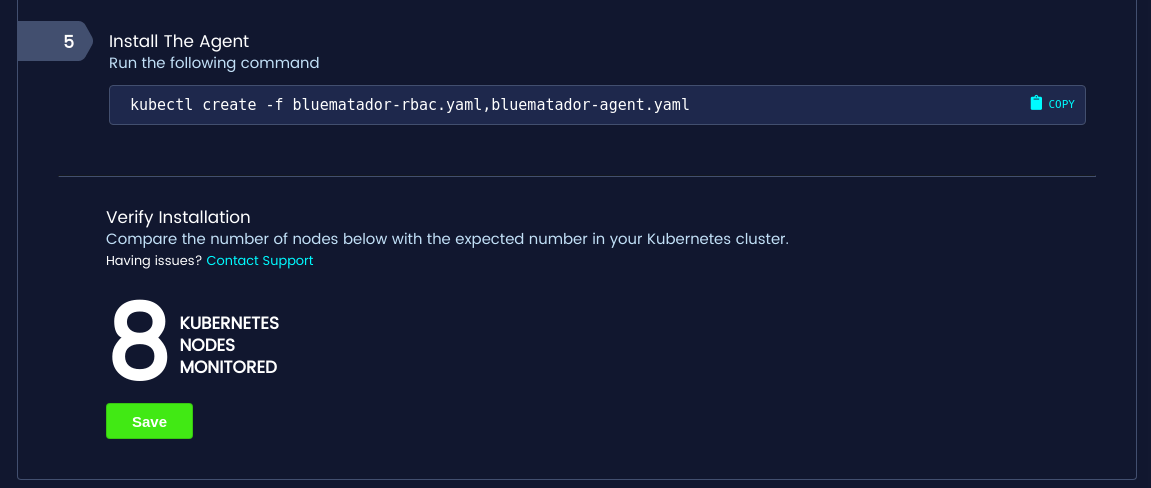
Once the Kubernetes agents are connected, Blue Matador automatically enables and manages over 30 triaged events without any additional configuration.
How Blue Matador Monitors Nodes
Kubernetes makes it extremely easy to focus on your application and related services without worrying about the nodes. This does not mean you can forgo monitoring your nodes, however. Without healthy nodes, your pods will be unable to run. Blue Matador automatically tracks node health, lifecycle events, and limits so you can stay ahead of these issues.
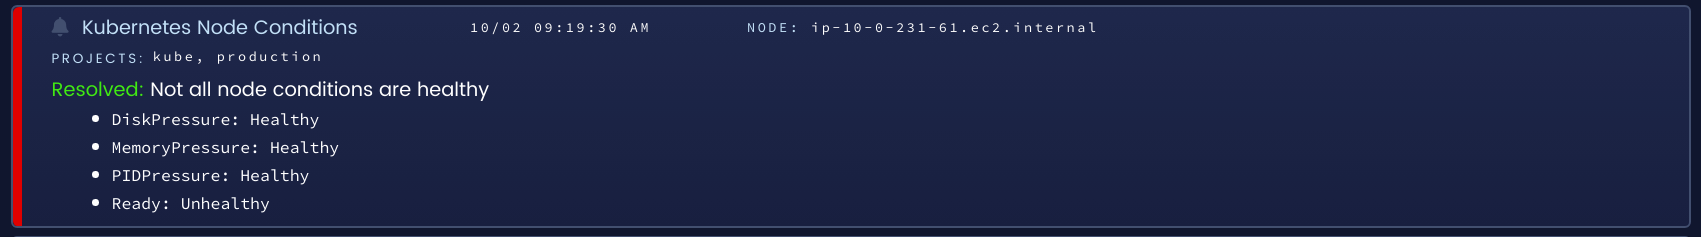
Blue Matador monitors node health in two ways: the agent checks for Kubernetes API access and each node’s self-reported node conditions. Issues with either of these will often indicate that a pod will be unable to schedule on a node and that a replacement node should be created while the underlying cause is investigated.
Node lifecycle refers to adding, removing, and rebooting nodes. Blue Matador creates lower-priority events for these that can be used as correlation to other issues in your system. For example, if you scale down your cluster, that could lead to pod scheduling issues a few hours later.
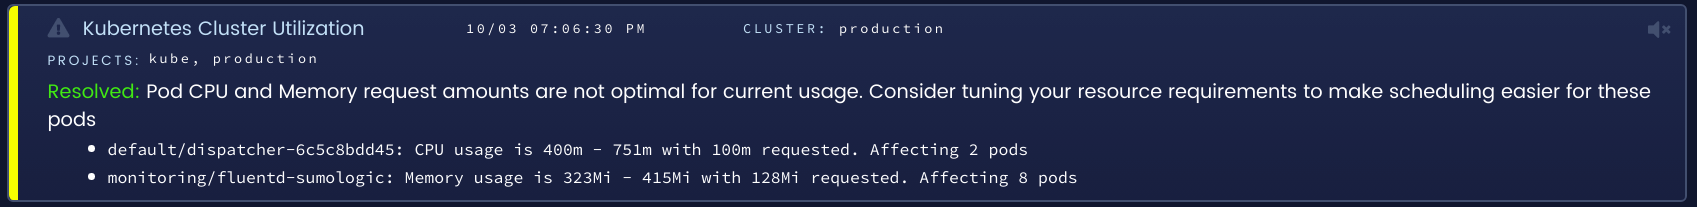
Kubernetes nodes are backed by physical or virtual servers with limited resources. If you are running Kubernetes using AWS, Azure, or GCP, then there may be additional limits placed by your cloud provider to prevent you from overloading nodes based on VM size. Blue Matador monitors nodes for OOM events, number of pod limits, pod eviction events, and the amount of requested CPU and Memory for all pods on a node so you can stay ahead of these limits before your application is severely impacted.
How Blue Matador Monitors Controllers & Services
With node health taken care of, the next level of Kubernetes resources that Blue Matador monitors are your pod controllers and services. Pod controllers such as DaemonSets, Deployments, ReplicationControllers, CronJobs and Jobs are responsible for managing the lifecycle of your pods and provide a high-level view into the health of the pods they manage.
Blue Matador focuses mostly on the basic function of all controllers: how many pods do I have, and how many pods should I have? If these numbers do not match up over a significant period of time (usually several minutes) then further investigation may be warranted. In the case of CronJobs and Jobs, Blue Matador also detects when your jobs are failing and hitting their backoff limit and warns you that this is occurring.

How Blue Matador Monitors Pods
At the lowest level, we have pods. Pods are responsible for managing the CPU, memory, and network for your containers. A pod’s lifecycle is supposed to be very simple: schedule, run, and terminate. As with any complicated system though, you will very likely run into issues with some pods at different points in their lifecycle.
In the schedule phase, Blue Matador looks for pods that are unable to be scheduled because either 1) their node selector matches no nodes or 2) no node has enough resources. When you make updates to your pods with kubectl, those operations will usually succeed on the CLI even if they do not actually succeed. Blue Matador will tell you that your pod never scheduled because you specified 10 CPU cores instead of 1, if it cannot mount a persistent volume, or if the scheduler refuses to schedule your pod for any reason.
In the run phase, many things can go wrong. Containers can go OOM (out of memory), restart, get throttled on CPU usage, and be evicted. Blue Matador will tell you when these issues occur and automatically triages these events if they are persistent so you can address them.
What can go wrong in the termination phase? As it turns out, Kubernetes is not impervious to oddities, and terminated pods may not actually terminate. If your pods are stuck terminating, they can prevent your deployments from rolling out, appear to take up resources, and generally cause confusion. Blue Matador detects this so you can correlate it to other issues. If you are utilizing PreStop hooks in your pods, Blue Matador also detects failures at that stage so you are not failing silently.
Conclusion
Kubernetes has simplified container orchestration in a way that no other solution was able to. In order to accomplish that, Kubernetes has become the complicated piece of infrastructure and as we’ve shown there is a lot to monitor to ensure your Kubernetes cluster is running smoothly. Blue Matador alleviates some of the pain of monitoring such a complicated system by automatically configuring, maintaining, and triaging events for all of the major components in your cluster.


