
So you’ve got a shiny new Kubernetes cluster up and it’s a dream. Deploying code is easy, scaling is a breeze, and you’ve never felt so efficient. However, despite claims that Kubernetes is self-healing, there’s still a nagging feeling in the back of your mind that wants to make sure your cluster is running smoothly. Just like any other tool, you need a monitoring solution to give you insight into Kubernetes. To that end, there are dozens of Kubernetes monitoring tools, including Blue Matador, but in this post we’ll just review two very prominent tools: Prometheus and Datadog.
We’ll discuss these two monitoring solutions in the following categories:
Afterwards, you should have the knowledge you need to decide on a monitoring solution for you and your cluster. Let’s get started.


Installation process
It’s pretty easy to install both Prometheus and Datadog. Just create some resources in Kubernetes, and you'll be running in no time at all.
Installing Prometheus
Because Prometheus is one of the monitoring solutions that the Kubernetes documentation specifically recommends, it’s unsurprising that the installation process is pretty easy. All you need to do it create a cluster role, a config map, and a deployment for Prometheus, most of which can be copied and pasted from any number of tutorials online (here’s one to get you started). It takes only a couple minutes to get set up.
However, Prometheus comes with a whole ecosystem of tools that support it. If you want more sophisticated dashboards and graphs, you’ll have to spin up Grafana and integrate with it. If you want a decent alerting system, you’ll need to install AlertManager. As you’ll see, this ends up making Prometheus a little more complicated to set up than Datadog. It’s still not difficult, but it’s not trivial either.
Installing Datadog
If you already have a Datadog account, getting metrics into Datadog is relatively simple. You’ll just configure RBAC permissions and install the Datadog agent as a DaemonSet. If you want to send custom metrics to Datadog, you’ll need to do a little more configuration.
Datadog ships with visualizations and an alerting layer, so there’s no need to do any additional setup.
Verdict
All in all, Datadog is a little easier to install that Prometheus, as you might expect when comparing a managed service to an open source solution. However, neither is too difficult.
Visualizations
Of course, we installed a monitoring solution because we want to get some value out of our metrics. For many people this equates to one thing: graphs.
Metric visualization in Prometheus
While Prometheus itself ships with a graphing tool, its functionality is fairly rudimentary. It’s more likely the case that any Prometheus installation actually relies on Grafana for visualization, and for the purpose of this comparison, we’ll consider Grafana’s visualization capabilities.
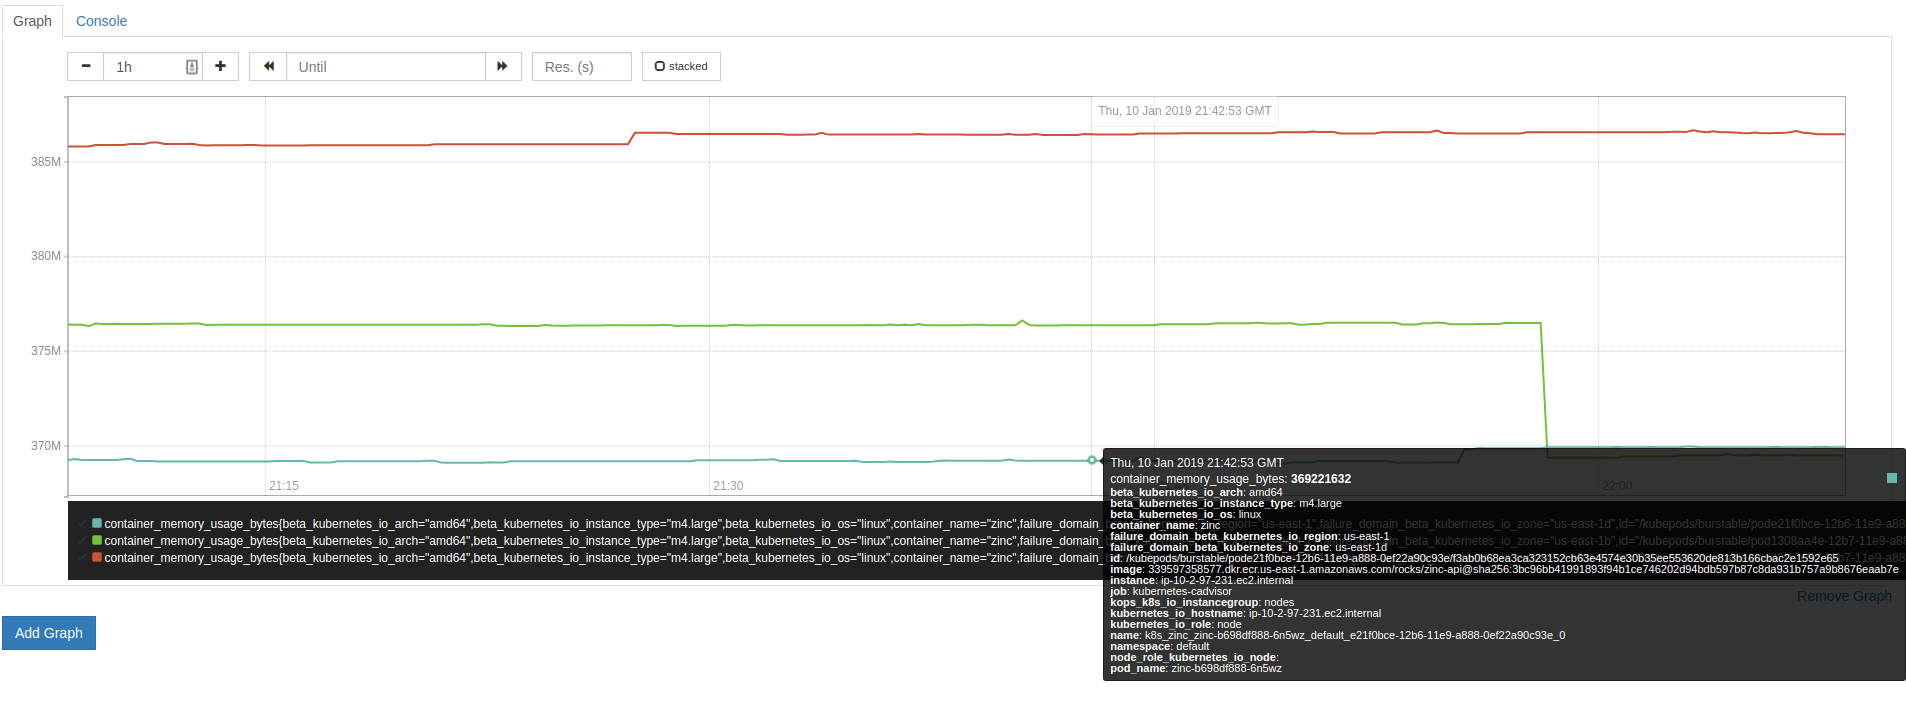
A graph in Prometheus. It’s not great.
Grafana makes it easy to create dashboards and graphs of your metrics. There are loads of different widgets and options that allow you to tailor your visualization to your needs. And it comes with an easy-on-the-eyes dark theme, if that’s a consideration for you.
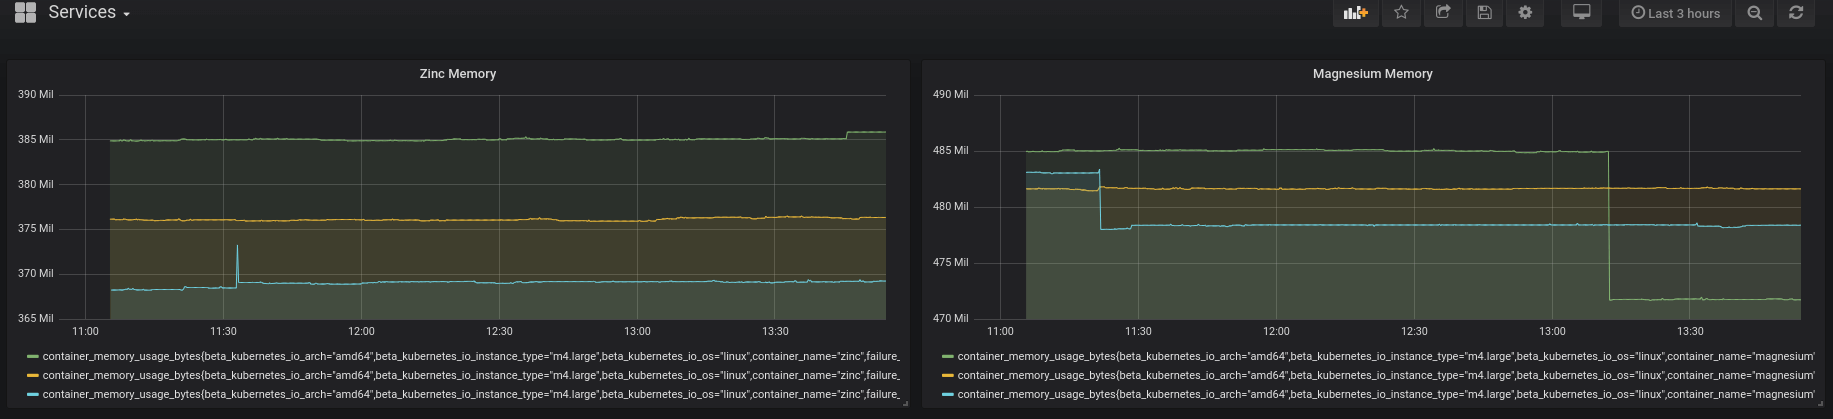
Visualizing cluster data in Grafana.
Metric visualization in Datadog
Datadog provides a whole bunch of graphs. Like Grafana, there are many widgets to create any dashboard you could think of. The tagging system is useful and the query language is robust. Datadog also comes with preset Kubernetes dashboards.
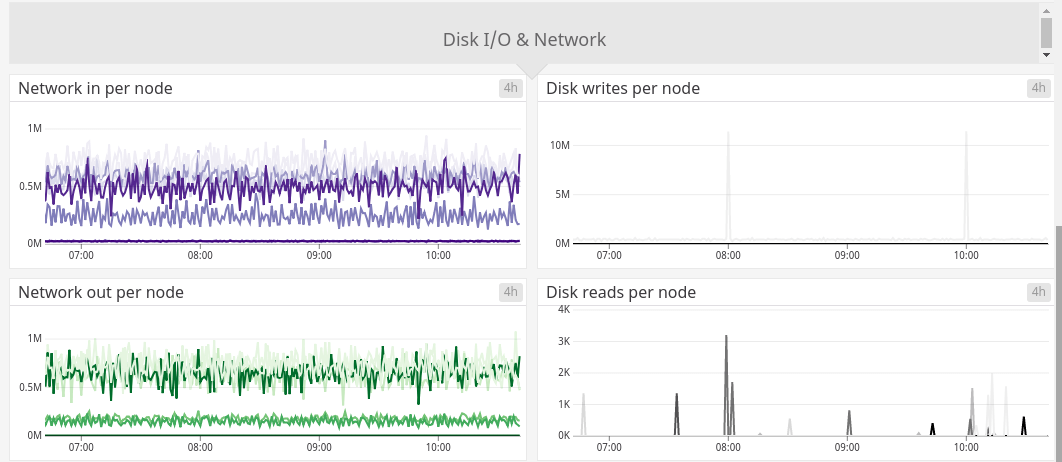
Part of Datadog’s built-in Kubernetes dashboard.
Verdict
Grafana and Datadog are very similar in their visualization capabilities. Both have every feature you need to get started and allow you to put together dashboards that will help you monitor your Kubernetes cluster. This one’s a tie.
Finding Kubernetes events
Metrics aren’t the only thing to monitor in Kubernetes. Kubernetes also generates API objects called Events that describe things happening in your cluster, such as containers running out of memory, failing to mount a volume, nodes becoming unscheduleable, etc. Knowing about events in Kubernetes is important as it can be the first step to detecting a bad situation.
Kubernetes events in Prometheus
Prometheus doesn’t automatically expose Kubernetes events, so you’ll need a different solution to help you with this problem. There is a project on Github that will export Kubernetes events as Prometheus metrics. You can then import these event metrics into Grafana.
Kubernetes events in Datadog
Datadog’s agent will gather events from your Kubernetes cluster and then dump them into the “Events” section of the app. It’s not entirely obvious, but you will have to enable it, and you will also have to understand and set up alerts for events to get value from them.
As far as visualizing Kubernetes events, each event typically only lists the “Reason” part of an event, so you end up with an event containing a ReplicaSet and a string like “OOM” or “KILL.” The UI that shows pod labels is also pretty cramped and hard to read.
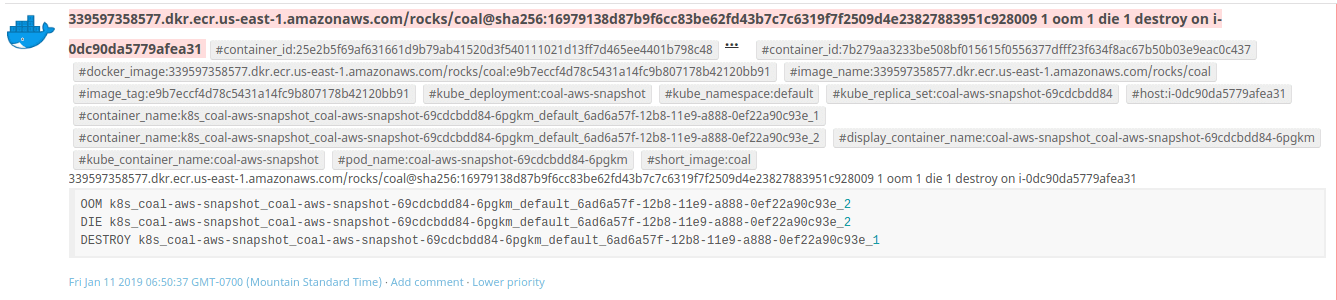
An Event In Datadog. That’s a lot of tiny text in a small space!
Verdict
You can rig your Prometheus setup to expose Kubernetes events, but the solution is not optimal. Datadog takes this one since it has an officially supported method for doing this. However, Datadog’s UI for viewing events leaves something to be desired, and doesn’t help with much more than a high level understanding that something happened.
Alerting and notifications
A monitoring solution that can’t tell you when something goes wrong is not very useful. In this section, we’ll talk about the alerting and notification engines in Prometheus and Datadog that can help you stay on top of your cluster health.
Alerting in Prometheus
Just like Grafana is required to do any meaningful visualization, you’ll need to install AlertManager to get useful notifications from Prometheus. That said, once you’ve installed AlertManager, it’s got some pretty cool capabilities. You can group alerts together into one notification, or even silence specific alerts for a period of time. There’s also a neat feature called inhibition that allows you to silence certain classes of alerts when another type of event is active (consider the case that if CPU is high on a container, you might not care to know that the load is also high).
The drawback to AlertManager, however, is that all notification rules are set up through a complicated YAML file that you feed to AlertManager on startup (and which AlertManager will check for updates). This file can get unwieldy as the complexity of your alerting setup increases, and, as we’ve all experienced, making typos and slight errors in config files can have disastrous effects on a system. Alert thresholds and metrics are also set up in Prometheus’s YAML configuration, so splitting alerting between these two places can also be a little confusing.
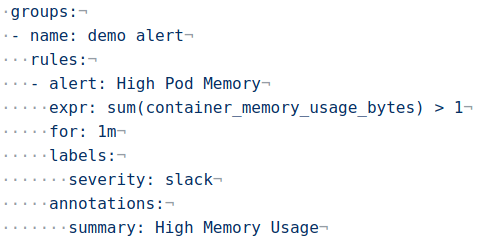
This is the config for a single alert (minus notifications). Imagine doing it hundreds of times!
Alerting in Datadog
While Datadog lacks some of AlertManager’s cool notification rules like inhibition or granular silencing, it has an incredibly robust system of detecting error states. Datadog calls these alerts Monitors, and they can do anything from threshold and anomaly detection on a metric to checking an event for a specific string.
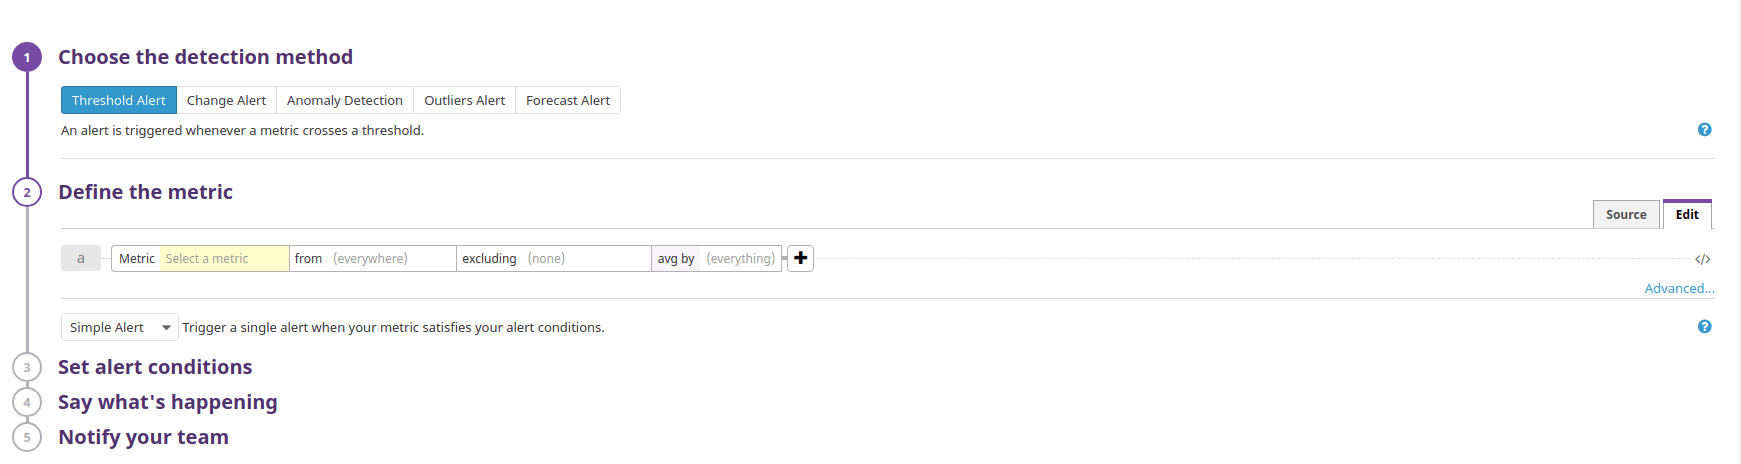
Datadog provides a nice UI for configuring alerting.
By default, Datadog will notify your team through email, but many services have Datadog integrations that let you get notifications through your preferred incident management system.
Verdict
Which service you select depends on your use case. If you want tight control over what alerts get sent to your team, Prometheus and AlertManager are probably your best bet. If you’re looking for complicated alert conditions or you really hate config files, you’ll probably want to go with Datadog.
Conclusion
Both Prometheus and Datadog are fully featured, robust monitoring solutions. However, they require extensive configuration to get maximum benefit from monitoring, and they assume that as the DevOps professional, you will know all the things that could possibly go wrong and how to check for them. However, Kubernetes is a relatively new tool, and even with experience, there is always more to learn. And even if you do know all the things to monitor, who’s got time to endlessly configure a system and watch graphs for hundreds or thousands of resources?
Blue Matador will monitor your Kubernetes cluster and all its important metrics and events, and let you know when you need to take action. It can ease the nagging anxiety that there are unknowns in your system waiting to cause you and your team headaches. Best of all, Blue Matador does it all without configuration.
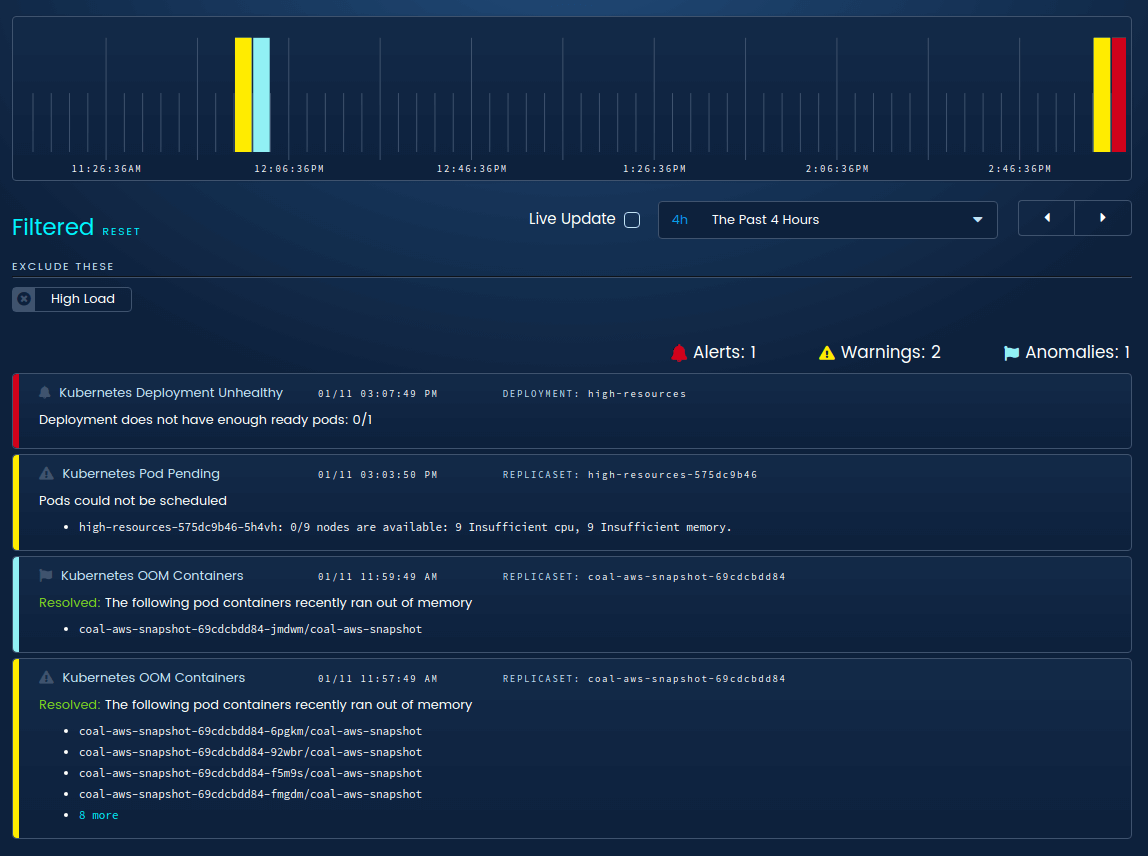
Blue Matador detects Kubernetes events like inability to schedule pods, or a deployment not having enough pods.
All without any configuration!
All you have to do is install our agent through a DaemonSet and then sit back and rest assured that your Kubernetes cluster is in good hands. Click here to start a free trial.


