
Kubernetes events are a resource type in Kubernetes that are automatically created when other resources have state changes, errors, or other messages that should be broadcast to the system. While there is not a lot of documentation available for events, they are an invaluable resource when debugging issues in your Kubernetes cluster.
In this post we will learn how to look at events, learn about a few specific event types, and discuss how to monitor Kubernetes events.

How to pull Kubernetes events using kubectl describe pod and kubectl get events
If you’ve been using Kubernetes for a while, chances are you’ve seen Kubernetes events before. Using kubectl, you may have seen them when describing a pod or other resource that is not working correctly.
For the most part, events are easy to see when you are trying to debug issues for a specific resource. Using kubectl describe pod <podname> for example will show events at the end of the output for the pod. Only events that have occurred relatively recently (within a few hours) will appear.
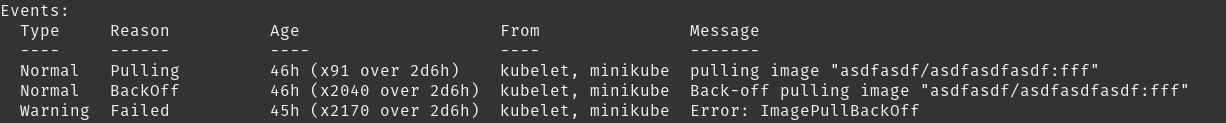
Events for a pod trying to run an image that does not exist
It is important to realize that events do not propagate in a way that you might expect. For instance, if your container is unable to start because the docker image cannot be pulled (as seen in the above example) the events are only visible on the pod, not on any ReplicaSet, DaemonSet, StatefulSet, Job, Deployment, or any other resource that created the pod.
Another way to view events is to grab the events from the resources API directly. This can be done using kubectl get events, which displays recent events for all resources in the system.
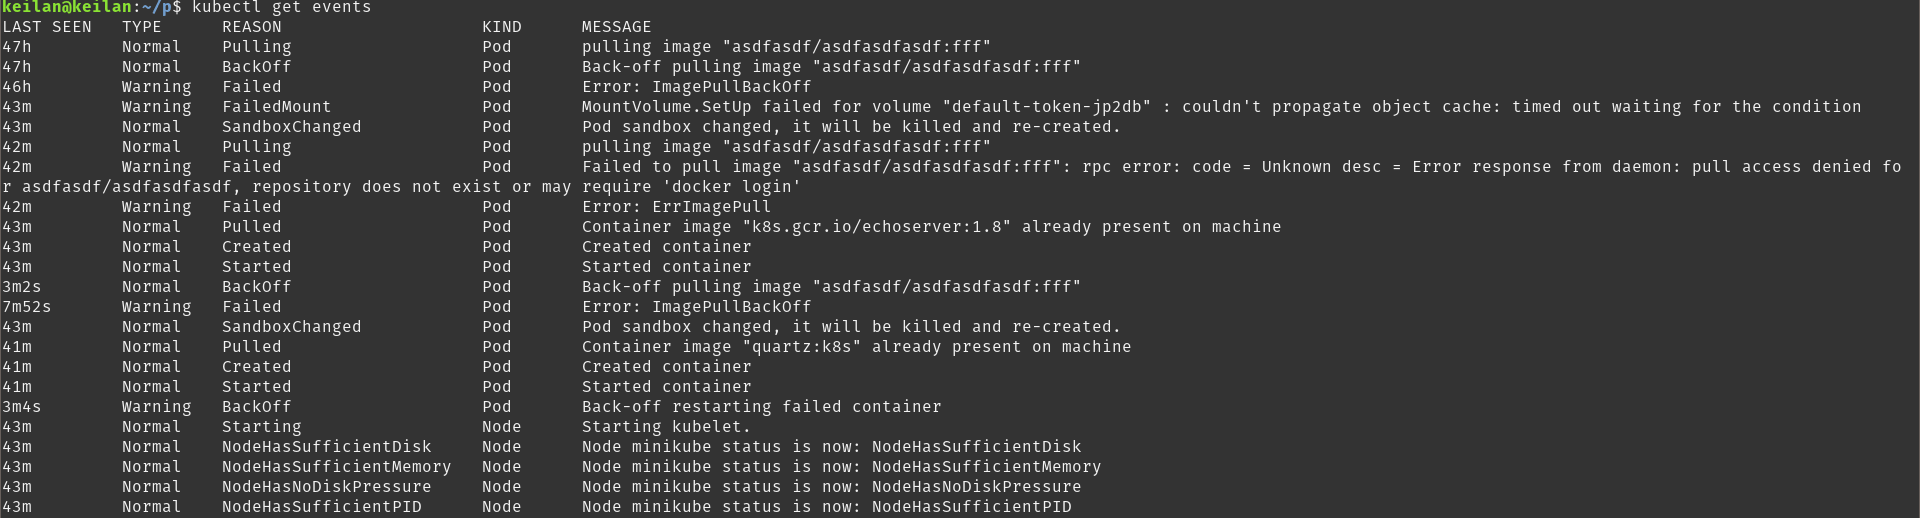
Events from the events API
In a production cluster, this output is probably not that helpful because there will be many informational events for resources you do not care about. This is easily solved using the --field-selector argument to the call to filter the events. Here are a few quick examples that you will find useful:
Warnings only
kubectl get events --field-selector type=Warning
No pod events
kubectl get events --field-selector involvedObject.kind!=Pod
Events for a single node named “minikube”
kubectl get events --field-selector involvedObject.kind=Node,involvedObject.name=minikube
Getting events in this manner can help you debug issues that are not specific to a single resource, and is a great way to get a glimpse into the inner workings of your cluster.
Kubernetes event reasons
In the above examples you can see a column called “Reason” with a one-word description for each event. Unfortunately I have been unable to find any comprehensive documentation on what all of the reasons mean. The source code for kubelet does have a file that defines each reason with a little bit of context, but it is by no means exhaustive. At Blue Matador, we have been able to figure out a reliable way to monitor these events by sifting through the data while issues were occurring on ours and our users’ clusters. I will go over some of the useful events that you should watch out for.
| If you are interested in a fully managed solution to monitoring Kubernetes events, check out Blue Matador cloud monitoring. Blue Matador automatically does event detection and classification for dozens of Kubernetes events and metrics. Learn more > |
Kubernetes "failed" events
The first event we will cover is the one from my first example: Failed. Failed is a seemingly vague reason that actually only corresponds to issues creating a container. The most common specific type of failure I have seen is the system being unable to pull the docker image. We’ve all had this happen before, usually due to either a typo, a permissions issue to your docker repo, or a build failing upstream from your deploy. Your container simply will not run until you fix the issue. If you are automatically deploying updates to your cluster, you will want to look out for this event because it can easily break your deployments.

ImagePullBackOff detected in Blue Matador
Kubernetes "evicted" events
One of the most useful events we monitor at Blue Matador happens when a node begins evicting pods. The Evicted reason is actually not included in the source file with the other events, but can be found in the eviction source code. This event happens when a node determines that pods need to be evicted, or terminated, to free up some resource such as CPU, memory, or disk. We were made aware by one of our users that this can have devastating consequences if the kubelet is unable to determine the best resources to evict. The specific case that one user experienced involved the kubelet detecting disk pressure, then evicting pods that have no effect on disk usage. The pods would then get scheduled on other nodes, overloading their other resources and also causing evictions. Knowing when evictions happened, and being able to correlate it with other events in that time frame, has helped them avoid the issue.
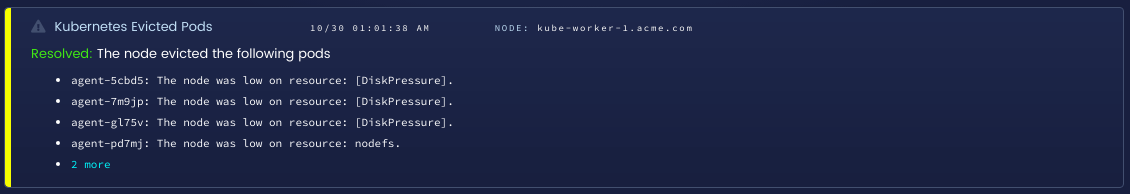
Evicted pods detected in Blue Matador
Kubernetes FailedMount and FailedAttachVolume events
Many workloads rely on network-attached storage to provide persistent storage to pods. Running Kubernetes in a cloud such as AWS or GCP can ease the pain of managing this storage, but what do you do if it does not work? The FailedMount and FailedAttachVolume events can help you debug issues with storage. These events will prevent pods from starting correctly. You may think that your pods are just slow to start, but if there are permissions or networking issues when creating network volumes, you will need to rectify them to get your pods working again.
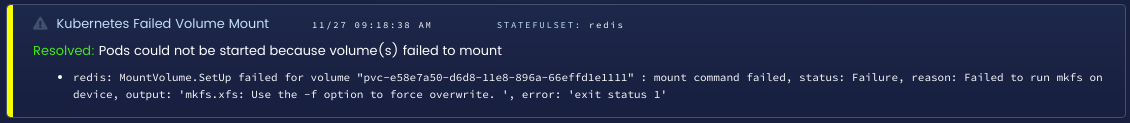
Failed volume mount detected in Blue Matador
Kubernetes FailedScheduling events
Once you’ve moved many workloads to Kubernetes, you may need to scale your cluster. If you do not stay on top of your resource management, you may notice new pods not appearing at all, which no explanation as to why. The FailedScheduling event happens when the scheduler is unable to find a node to run your pods. The message for the event is actually incredibly useful, and will often include the exact conditions that prevented it from scheduling.
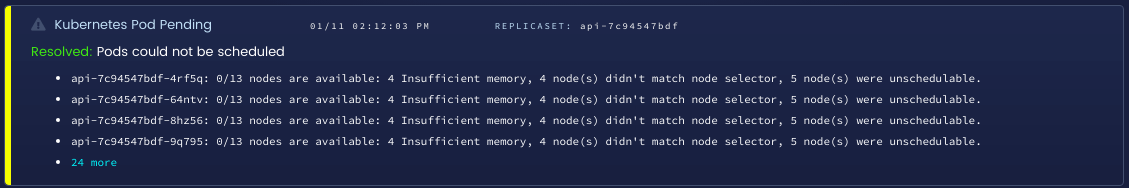
FailedScheduling detected in Blue Matador
Important Kubernetes node events
Finally, there are many events that just describe important system events. On their own these events may not be very interesting, but if you can correlate them to other events, unhealthy deployments, and 5xx errors in your system, they are a valuable tool in debugging your cluster as a whole. A few of these include Rebooted (node rebooted), NodeNotReady, and HostPortConflict.

Node reboot detected in Blue Matador
How to filter Kubernetes events
While the events API has many useful events that are sometimes the only way to see serious issues in your cluster, it also contains many events that are mostly just noise. Generally speaking, you can ignore any events that are of type Normal. These events are usually just informational and will describe pods starting and stopping, health check failures (usually while pods are starting), and the extremely generic Backoff event occurs alongside many other events for specific failures.
To exclude Normal events from the results when using the events API, just filter them out using the --field-selector as before.
kubectl get events --field-selector type!=Normal
How to monitor Kubernetes events
Now that you know what Kubernetes events are, how to view them, and which ones are interesting, the next step is to actually monitor these events.
| Blue Matador automatically does event detection and classification for dozens of Kubernetes events and metrics, all with minimal setup. Learn more > |
If you have Prometheus set up to monitor your cluster, then you can write your own exporter or use this project to export kubernetes events. Then in Prometheus, you can use AlertManager to set up notifications when events happen.
If you use Datadog, you can enable Kubernetes event collection by setting the DD_COLLECT_KUBERNETES_EVENTS environment variable to true for your agents. Then, you can set up monitors for the event reasons you are interested in.
You can also use kubectl or access the API directly using a script if you are not using one of the mainstream monitoring tools. To get json output from kubectl, just pass the -o json flag to any get operation.
kubectl get events -o jsonConclusion
We’ve covered what Kubernetes events are, how to view events by resource, how to view and filter events for the whole system, and specific event types that can help you understand and debug issues in your Kubernetes cluster.


