
Log messages help us to understand data flow through applications, as well as spot when and where errors are occurring. There are a lot of resources for how to store and view logs for applications running on traditional services, but Kubernetes breaks the existing model by running many applications per server and abstracting away most of the maintenance for your applications. In this blog post, we focus on log management for applications running in Kubernetes by reviewing the following topics:
By the end of this post, you should have a good high level understanding of the essential concepts for logging with Kubernetes, and should be ready to begin implementing it for your cluster and logging use case.

How Kubernetes logging works
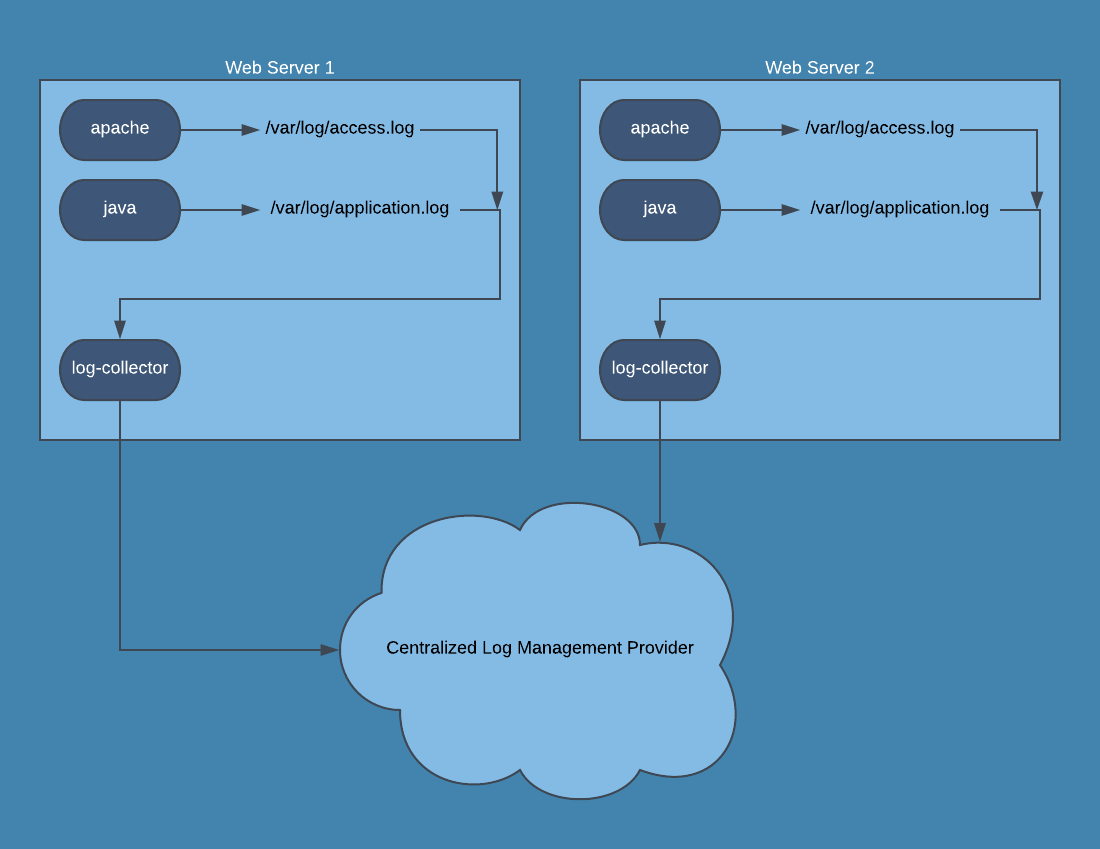
In a traditional server setup, application logs are written to a file such as /var/log/application.log and then viewed either on each server, or collected by a logging agent and sent to a centralized location.
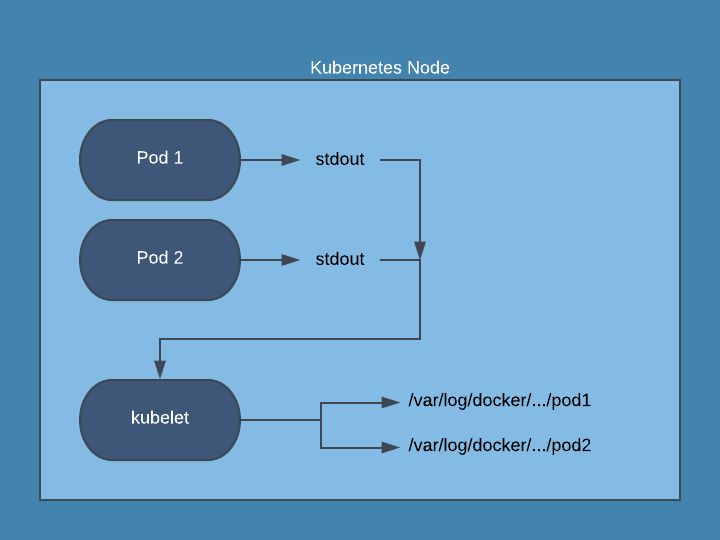
With Kubernetes, writing logs to disk from a pod is discouraged since you would then have to manage log files for pods that can be numerous and short-lived. Instead, your application should output logs to stdout and stderr. The kubelet running on each Kubernetes node will collect the stdout and stderr of each running pod and combine them into a log file that is managed by Kubernetes. Kubernetes will automatically manage logs for each container in a pod and restrict the log file size, with most installations keeping the most recent 10Mb of logs.
How to view Kubernetes logs
Pod logs can be accessed using kubectl log. By using kubectl you avoid accessing individual nodes to access the logs for pods running on those nodes, and are able to view logs from pods running on different nodes in real time. Here are a few examples of using kubectl to view logs for a pod:
View all available logs for a pod:
kubectl logs PODView logs for the last hour for a pod:
kubectl logs --since=1h PODView logs and then follow the live stream of logs for a pod:
kubectl logs -f PODView logs for a specific container of a pod in another namespace
kubectl -n NAMESPACE logs POD -c CONTAINERView logs for a random pod in a deployment:
kubectl logs deployment/DEPLOYMENTThese options can be combined and then used with grep to easily filter logs. Here is an example looking for recent exceptions on a pod
kubectl logs --since=1h -f POD | grep ExceptionAs you can see, kubectl logs is limited to viewing a single pod’s logs at a time. This can be fine for quick debugging or smaller systems, but eventually you will want a quick way to live-tail logs from many pods. This is where kubetail comes in. Kubetail is a small binary that essentially runs kubectl logs -f on multiple pods and combines the log data into a single stream. Kubetail supports many of the same options as kubectl, and the basic usage will cover most cases:
View logs for all pods with “my-app” in their name:
kubetail my-appView 15 minutes of logs for “my-app”:
kubetail my-app -s 15m
Centralized Kubernetes log management
Viewing logs using kubectl logs or kubetail is very convenient for live log streams, but it does not allow you to look at historical log data past a couple of hours or for pods that have been terminated. At some point, you will have to implement centralized log management for your Kubernetes logs in order to meet security and quality requirements for your organization.
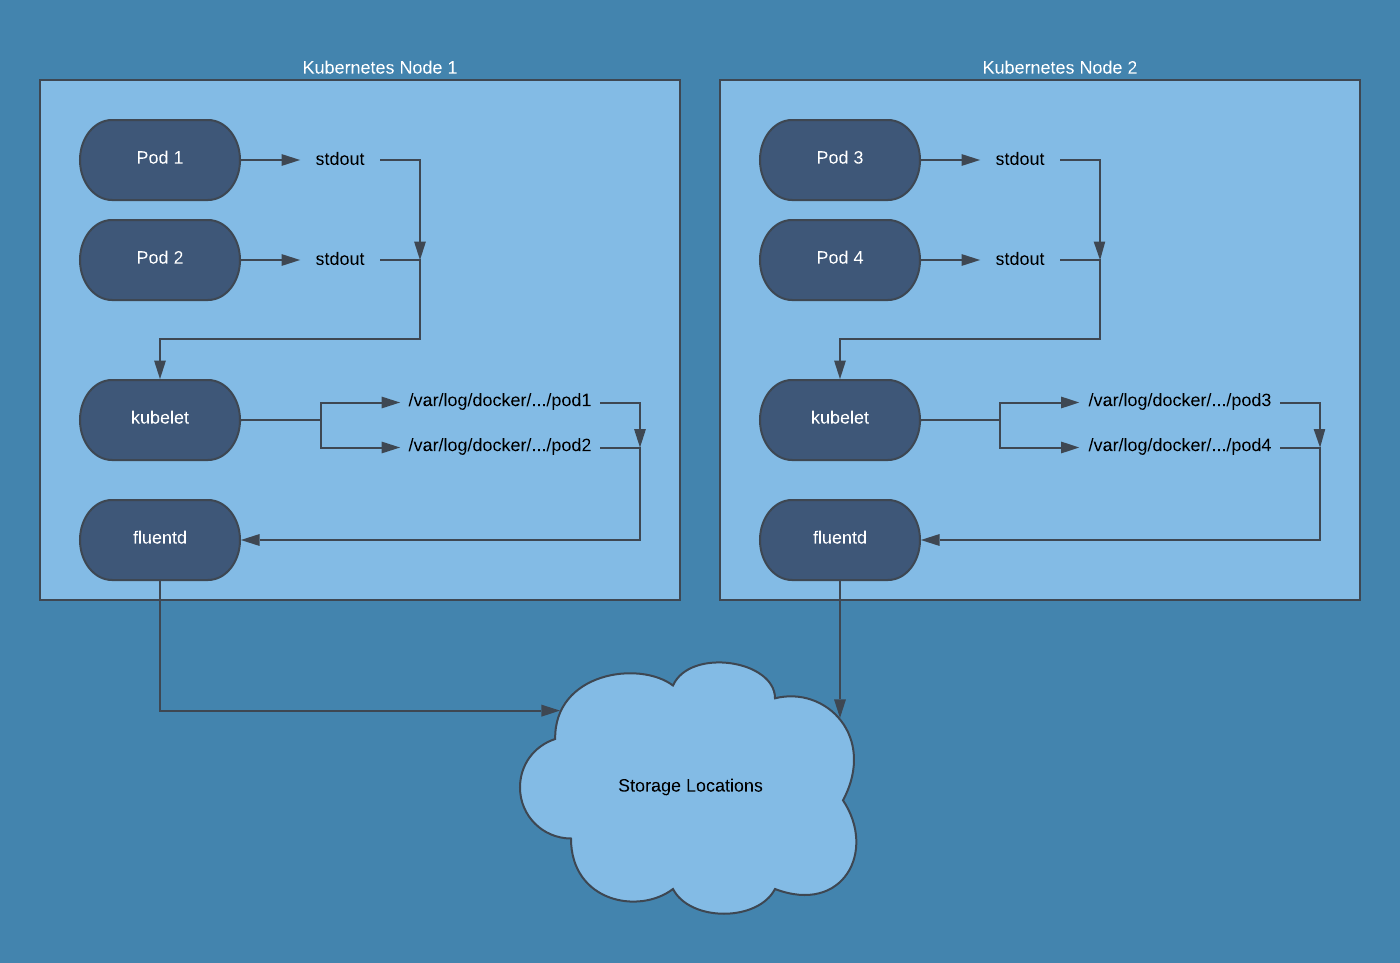
There are many solutions for collecting pod logs and shipping them to a centralized location, but I will focus on one of the most widely-used products to aggregate logs in Kubernetes: fluentd. Essentially, fluentd acts as a middleware that collects and parses logs from many sources, and then ships them to one or multiple destinations. Fluentd has a huge amount of plugins available and is flexible enough to collect and parse essentially any log type from any location, and send them to any other location. In a Kubernetes cluster, we rely on fluentd to collect the pod logs stored on the node filesystem, parse them from various formats (json, apache2, mysql, etc.) and ship them to a logging provider so they can be searched. This is accomplished by running a Fluentd DaemonSet. This DaemonSet runs a pod that collects logs from kubelet, the Kubernetes API server, and all of your running pods on each node. These logs are buffered in the fluentd pods and then sent to wherever you want logs stored: Amazon S3, Elasticsearch, or a third party log management tool.
I highly recommend not storing your Kubernetes logs in the same Kubernetes cluster that generates the logs. Running your own Elasticsearch setup tends to be tedious and time consuming when issues do occur, and running it inside the same cluster that generates logs can put you in a bad spot. If your cluster begins experiencing issues, your Elasticsearch setup will likely also be affected. Running queries in Elasticsearch can put extra strain on your nodes that are already having issues. Additionally, managing disk space, retention, and access to a self-hosted Elasticsearch cluster likely takes valuable time away from your product development, and is best left to log management companies. Here are a few providers, in no particular order, that offer support for Kubernetes logging in some fashion, and some of them even have free tiers for smaller amounts of log data!
If you insist on keeping the logs within your infrastructure instead of using a third party, there are many other blogs detailing this setup:
- Logging in Kubernetes with Elasticsearch, Kibana, and Fluentd
- How To Set Up an Elasticsearch, Fluentd and Kibana (EFK) Logging Stack on Kubernetes
Whether you use a third party provider to store your logs, or run you r own Elasticsearch setup, you will likely need to configure your fluentd pods to collect and parse logs that are specific to your application. The fluentd Quickstart Guide is a great resource to understand how fluentd works and to find ways to configure sources, filters, and outputs.
Conclusion
We’ve gone over the basics of log management in Kubernetes vs. traditional servers, how to view pod logs in real-time using kubectl and kubetail, and how fluentd is used to ship logs from your Kubernetes cluster to a centralized log management service. You should now have a basic understanding of how logging works in Kubernetes, with tons of resources to check out for configuring log management in your production Kubernetes cluster.
Logs are important to monitoring your Kubernetes cluster, but they are not enough. If you are looking for a monitoring solution for Kubernetes, consider Blue Matador. Blue Matador automatically checks for over 25 Kubernetes events out-of-the-box. We also monitor over 20 AWS services in conjunction with Kubernetes, providing full coverage for your entire production environment with no alert configuration or tuning required.


