
![]() AWS Elastic Load Balancing is one of the most widely used of Amazon’s cloud services. In many AWS stacks, an Elastic Load Balancer (ELB) will be involved in almost every single request that customers make to your application. Since they are critical to the health of your application, properly monitoring ELBs is a top priority for most teams. In this blog post, we will go over how Blue Matador monitors Classic Elastic Load Balancers automatically and without configuration. We will cover the following topics:
AWS Elastic Load Balancing is one of the most widely used of Amazon’s cloud services. In many AWS stacks, an Elastic Load Balancer (ELB) will be involved in almost every single request that customers make to your application. Since they are critical to the health of your application, properly monitoring ELBs is a top priority for most teams. In this blog post, we will go over how Blue Matador monitors Classic Elastic Load Balancers automatically and without configuration. We will cover the following topics:
- How Blue Matador is Different
- Integrating Blue Matador with Amazon ELB
- Monitoring ELB Health
- Monitoring ELB Traffic
- Correlating ELB Events
Application Load Balancers and Network Load Balancers will be covered in a separate post soon.
How Blue Matador is Different
Blue Matador approaches monitoring differently from other monitoring tools. We want to reduce the toil in monitoring, help you surface critical production issues, and be proactive instead of reactive with your monitoring. All without the large up-front and ongoing maintenance that other tools require.
In addition, Blue Matador automatically creates events using machine learning with a dash of heuristics so you know when something requires your attention. These events are automatically categorized as Alerts, Warnings, and Anomalies to reflect the severity of the event.
Integrating Blue Matador with Amazon ELB
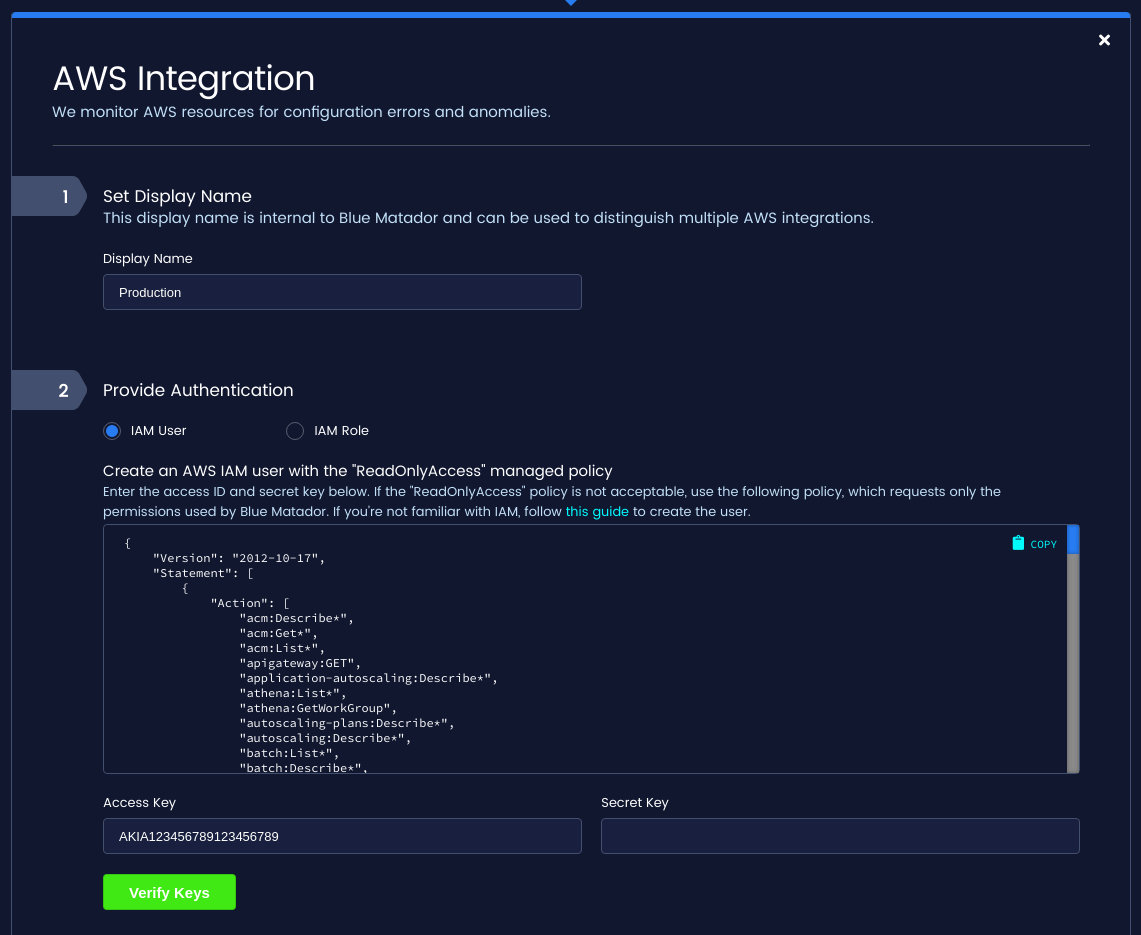
Amazon ELB is one of the AWS services that are automatically monitored by Blue Matador when your AWS integration is set up. Creating an AWS integration with Blue Matador is extremely simple and requires just an IAM user or IAM role with read-only access to your AWS account. A full guide for setting up your AWS integration with Blue Matador can be found here.
Once your AWS integration is created, Blue Matador will begin immediately collecting metadata and metrics for all of your Classic Elastic Load Balancers. The Elastic Load Balancing API is used to list your ELBs in each AWS region. CloudWatch metrics are then gathered for each Classic ELB in each region of your AWS account, which are then fed into our metric pipeline. Blue Matador collects metrics for Classic Elastic Load Balancers on a 5-minute interval. This is done to balance getting up-to-date metadata and metrics with the fact that both CloudWatch and Amazon ELB rate-limit requests.
Monitoring ELB Health
Elastic Load Balancing provides a great top-level view of ELB health via the Healthy Host Count and Registered Host Count. This tells us the number of hosts that are registered with the ELB and how many are healthy. We can compare these numbers to gauge the overall health of an ELB.
We expect that generally an ELB should not sit around empty. Not only does it waste the money that ELBs cost just to run, but it can introduce confusion and risk where traffic may go to a completely empty load balancer. If an ELB has no registered hosts for a prolonged period of time, Blue Matador will create an event.
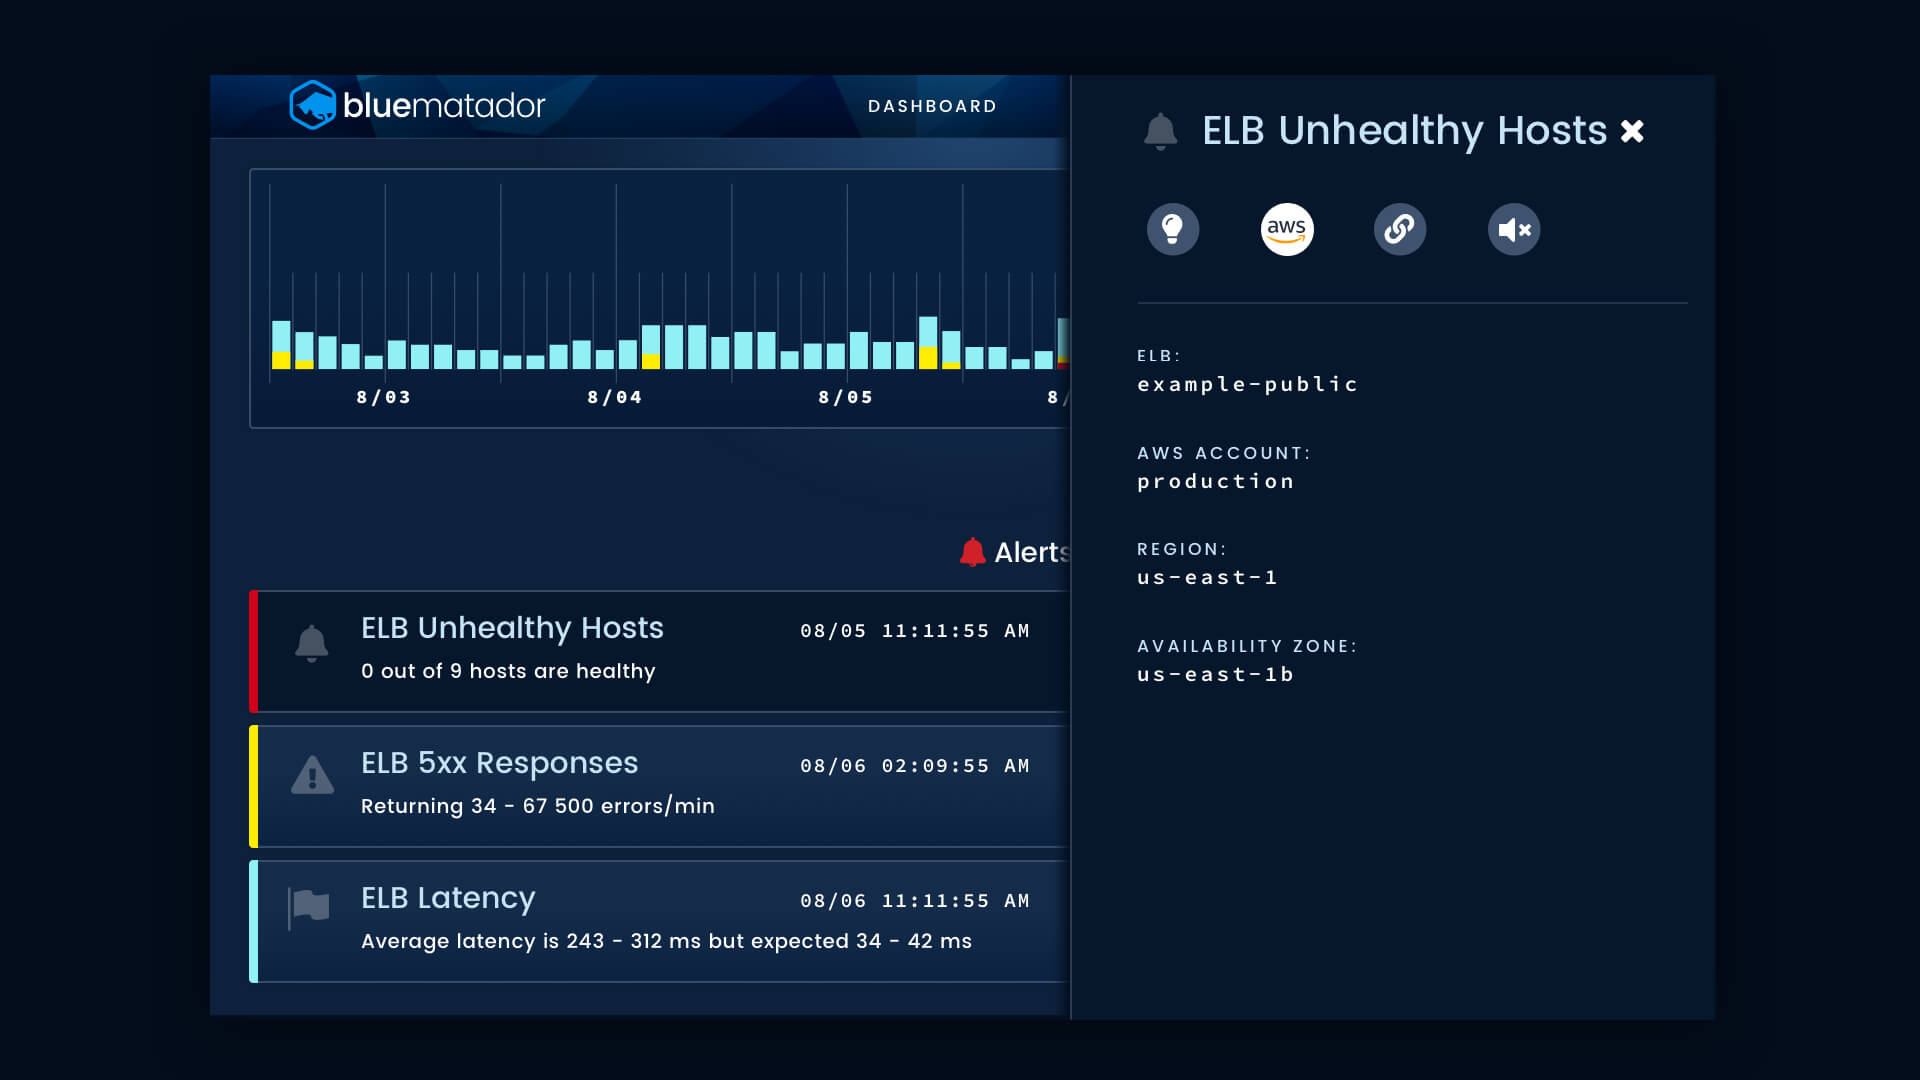
For Classic ELBs that are not empty, Blue Matador will create an event if some or all registered hosts are unhealthy. How the event is interpreted depends on how many healthy hosts are remaining. If there are no healthy hosts, then your ops team should investigate immediately since traffic will not reach any hosts.

Monitoring ELB Traffic
Blue Matador monitors several metrics related to ELB traffic. These may not indicate ELB health but are often an indication that your application is unhealthy or may become unhealthy soon.
Blue Matador watches the following for anomalous behavior and creates events that can be correlated with issues in other parts of your stack.
HTTP 400 and 500 Response Counts are measured for ELBs with HTTP or HTTPs listeners. These metrics are extremely useful for detecting changes in your application that may cause issues to any clients connected to your ELB.

Request Count is simply the number of requests made through a Classic ELB. Changes in request count are usually not that interesting, so very strict thresholds are used by Blue Matador to determine what an anomaly is in this case.
Backend Connection Errors occur when the ELB cannot connect to your registered hosts, and its value includes errors encountered when doing health checks, and can exceed the number of requests since connections are retried.
Latency measures the amount of time it takes your backend instances to process a request. Latency can be used to measure your application’s performance but it also tends to vary widely from one request to another.

The Surge Queue is the number of connections to an ELB that are waiting to be sent to a healthy host. An absolute limit of 1024 connections is imposed by AWS, after which connections to your ELB will be rejected. Blue Matador monitors the size of your suge queue against this limit so you can avoid dropping connections.
Correlating ELB Events
ELB events can easily be correlated with the other events generated by Blue Matador by using the TImeline. The Timeline page shows all of the events in your account in chronological order. Events are enriched with metadata, assigned a severity of Alert, Warning, or Anomaly, and can be filtered by any property on the event.
With all your events viewable in a single pane, you can correlate your ELB issues to EC2, Lambda, and other events to quickly perform root cause analysis.
Conclusion
We’ve gone over how to set up Blue Matador to monitor your Classic Elastic Load Balancers, what kinds of events Blue Matador automatically configures and maintains, and how these events can be used to troubleshoot your entire system.
In addition to our automated alerts for ELB, Blue Matador automatically creates alerts for other AWS services like Lambda, RDS, EC2, and more. In fact, Blue Matador has hundreds of alerts for AWS and Kubernetes that are automatically set up and dynamically maintained taking the time and toil out of monitoring.


