
![]() Amazon ECS allows you to easily run containers in AWS in units called tasks. Groups of identical tasks are called services, and groups of services running on the same infrastructure are called clusters. Since it is critical to the health of your application, properly monitoring ECS is a top priority for most teams. In this blog post, we will go over how Blue Matador monitors ECS tasks automatically and without configuration. We will cover the following topics:
Amazon ECS allows you to easily run containers in AWS in units called tasks. Groups of identical tasks are called services, and groups of services running on the same infrastructure are called clusters. Since it is critical to the health of your application, properly monitoring ECS is a top priority for most teams. In this blog post, we will go over how Blue Matador monitors ECS tasks automatically and without configuration. We will cover the following topics:
- How Blue Matador is Different
- Integrating Blue Matador with Amazon ECS
- Monitoring ECS Health
- Correlating ECS Events
How Blue Matador is Different
Blue Matador approaches monitoring differently from other monitoring tools. We want to reduce the toil in monitoring, help you surface critical production issues, and be proactive instead of reactive with your monitoring, all without the large up-front and ongoing maintenance required by other tools.
In addition, Blue Matador automatically creates events using machine learning with a dash of heuristics so you know when something requires your attention. These events are automatically triaged as Alerts, Warnings, and Anomalies to reflect the severity of the event.
Integrating Blue Matador with Amazon ECS
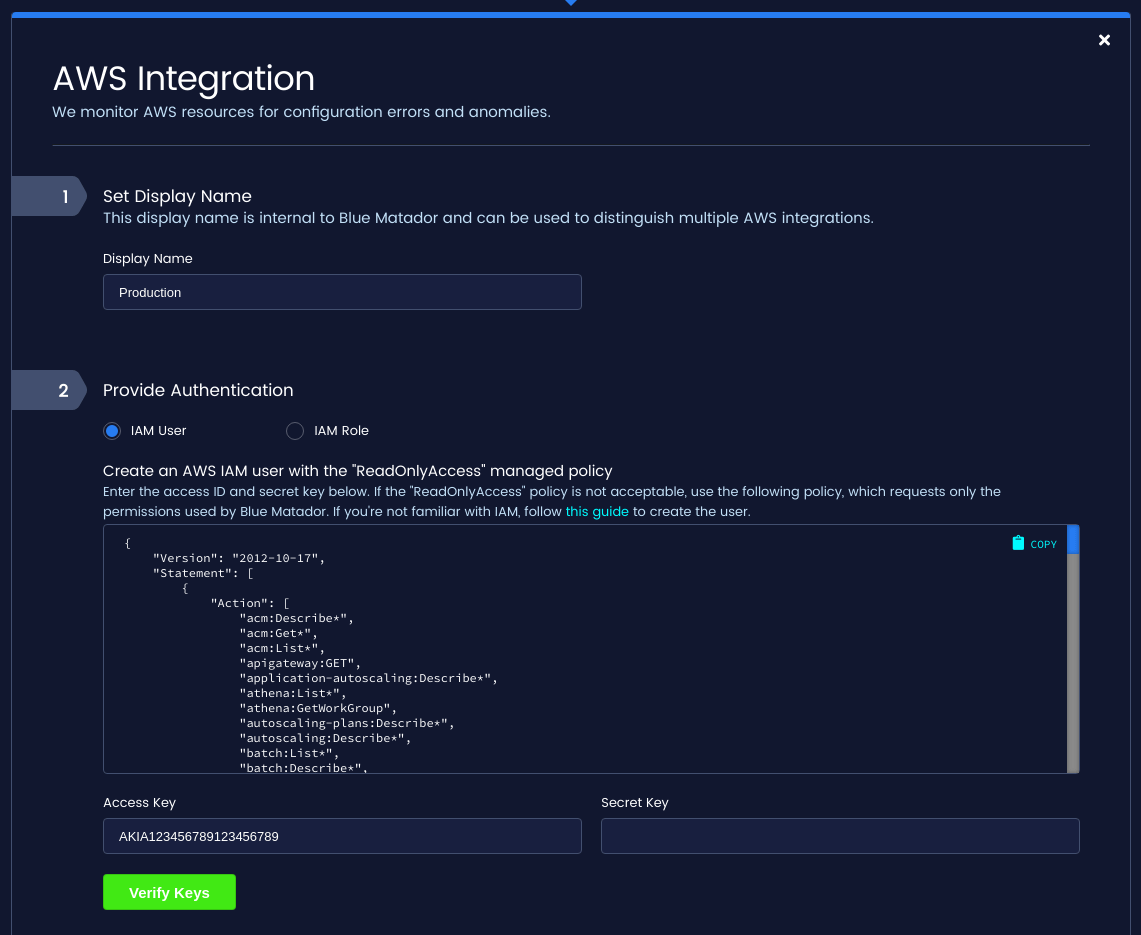
Amazon ECS is one of the AWS services that are automatically monitored by Blue Matador when your AWS integration is set up. Creating an AWS integration with Blue Matador is extremely simple and requires just an IAM user or IAM role with read-only access to your AWS account. A full guide for setting up your AWS integration with Blue Matador can be found here.
Once your AWS integration is created, Blue Matador will begin immediately collecting metadata and metrics for all of your ECS tasks, services, and clusters. The ECS API is used to list your resources in each AWS region. CloudWatch metrics are then gathered for each resource in each region of your AWS account, which are then fed into our metric pipeline. Blue Matador collects metrics for ECS on a 5-minute interval. This is done to balance getting up-to-date metadata and metrics with the fact that both CloudWatch and Amazon ECS rate-limit requests.
Monitoring ECS Health
Blue Matador monitors the following situations to help you keep up on the health of your ECS resources.
Resource Utilization measures the CPU and memory usage for services and clusters. Blue Matador monitors these metrics for high utilization so you can avoid a situation where you don’t have enough resources to run new tasks. Because containers are more ephemeral, tasks are not monitored for resource usage.

Running Tasks compares the number of tasks in a service against the desired number of tasks. If the service is missing tasks, your application may not be able to handle the load the service needs to handle. If the number of tasks drops to zero, the service will be completely unavailable.
Task Connectivity is whether the task is connected to ECS. The task can become disconnected if the network or security policies affecting the task change. Blue Matador detects if this is the case.
Task Health checks if any of the essential containers in a task are reporting an unhealthy state. These health status checks are defined during task definition.
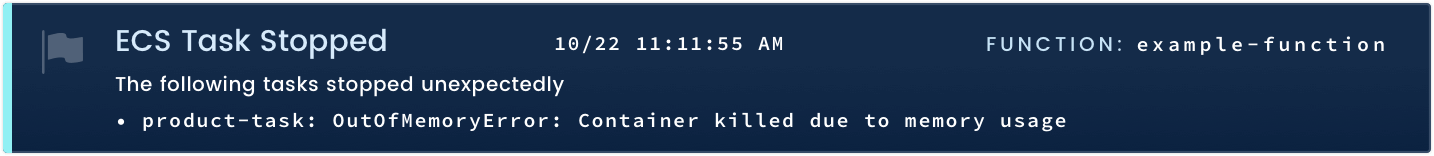
Blue Matador will create a Task Stopped event if a task stops for an unexpected reason. If the task is controlled by a service, it will be replaced, but if there is an issue with the service or task definition, it may be repeatedly stopped and replaced.
Task Pending occurs when a task is scheduled but does not start after a significant amount of time, Blue Matador will create an event. If tasks are unable to start, your application may experience a service interruption or degraded performance.
Correlating ECS Events
ECS events can easily be correlated with the other events generated by Blue Matador by using the Timeline. The Timeline page shows all of the events in your account in chronological order. Events are enriched with metadata, assigned a severity of Alert, Warning, or Anomaly, and can be filtered by any property on the event.
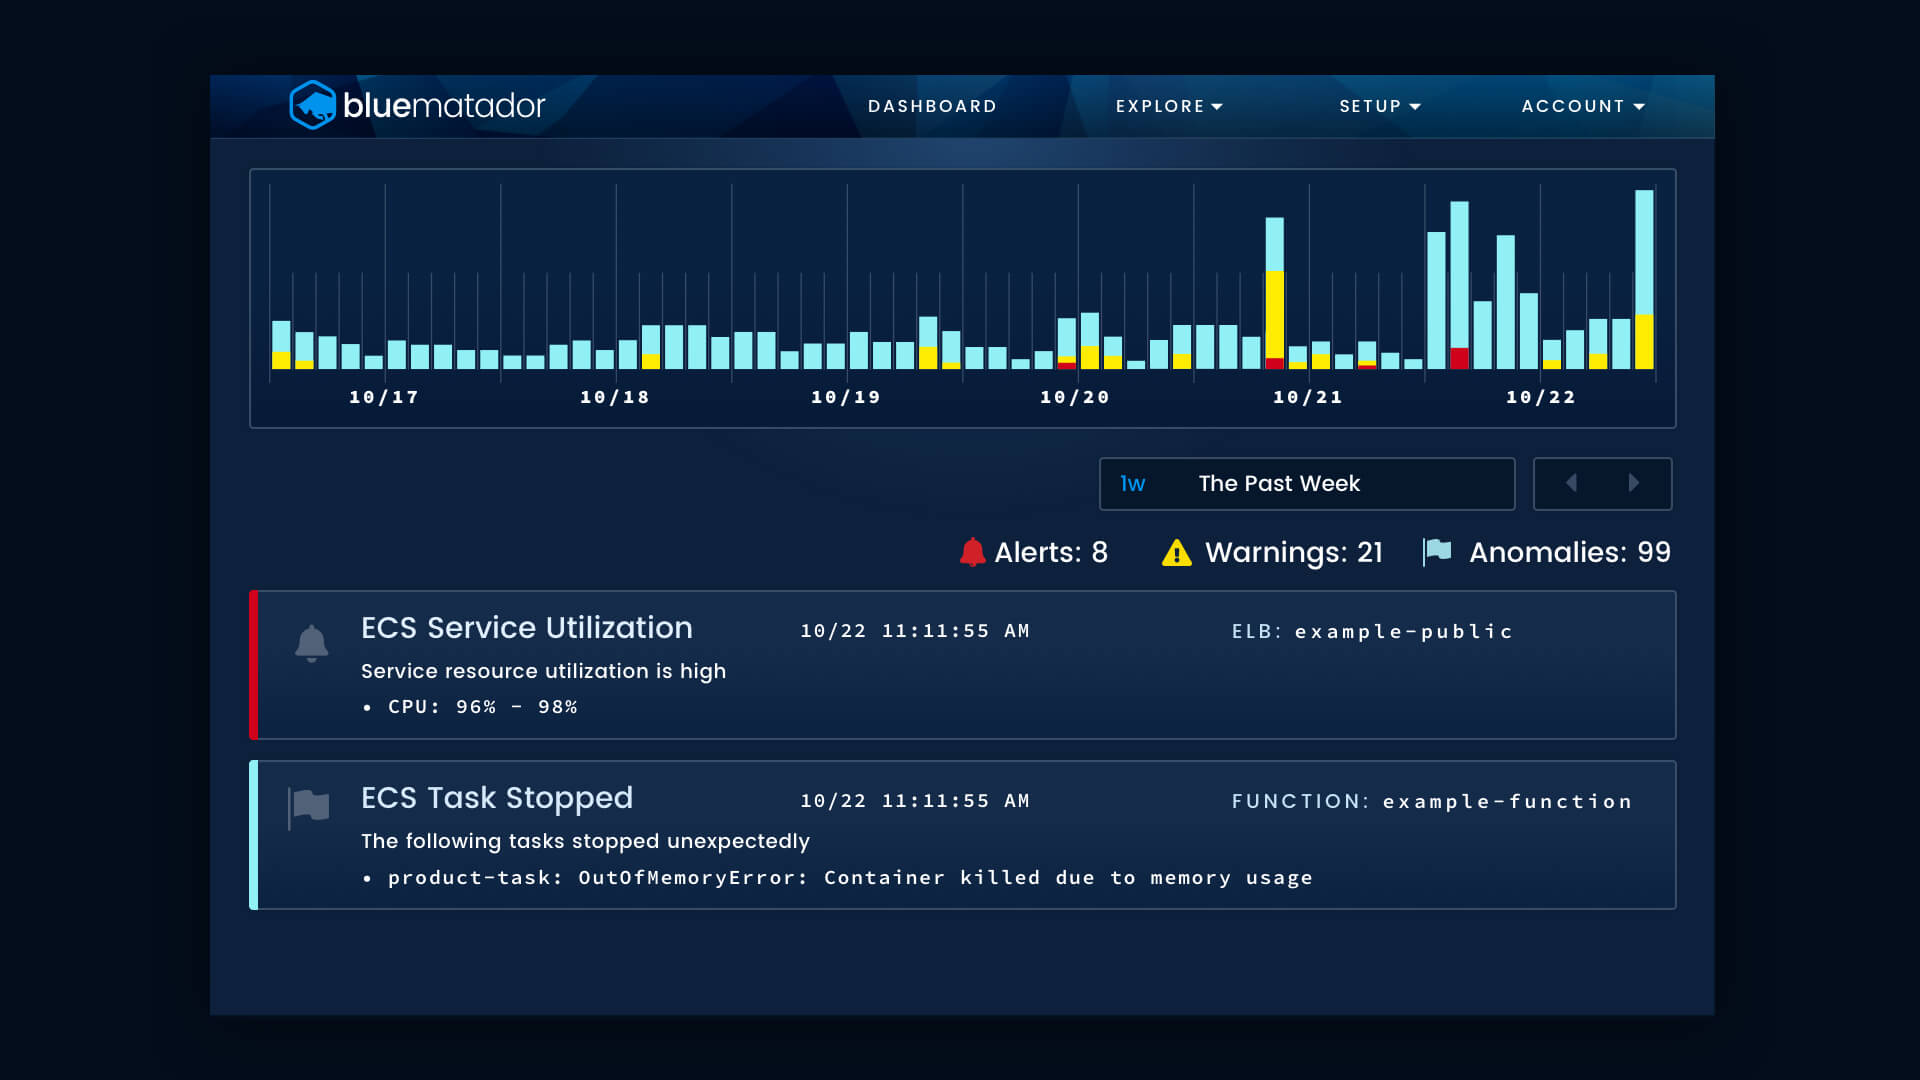
With all your events viewable in a single pane, you can correlate your ECS issues to DynamoDB, API Gateway, or any other events to quickly perform root cause analysis.
Conclusion
We’ve gone over how to set up Blue Matador to monitor ECS, what kinds of events Blue Matador automatically configures and maintains, and how these events can be used to troubleshoot your entire system.
In addition to our automated alerts for ECS, Blue Matador automatically creates alerts for other AWS services like ELB, RDS, EC2, and more. In fact, Blue Matador has hundreds of alerts for AWS and Kubernetes that are automatically set up and dynamically maintained taking the time and toil out of monitoring.


