
Amazon RDS allows you to easily run databases in AWS without actually having to manage database servers. Since your databases are critical to the health of your application, properly monitoring RDS is a top priority for most teams. In this blog post, we will go over how Blue Matador monitors RDS automatically and without configuration. We will cover the following topics:
- How Blue Matador is Different
- Integrating Blue Matador with Amazon RDS
- Monitoring RDS Health
- Correlating RDS Events
How Blue Matador is Different
Blue Matador approaches monitoring differently from other monitoring tools. We want to reduce the toil in monitoring, help you surface critical production issues, and be proactive instead of reactive with your monitoring, all without the large up-front and ongoing maintenance required by other tools.
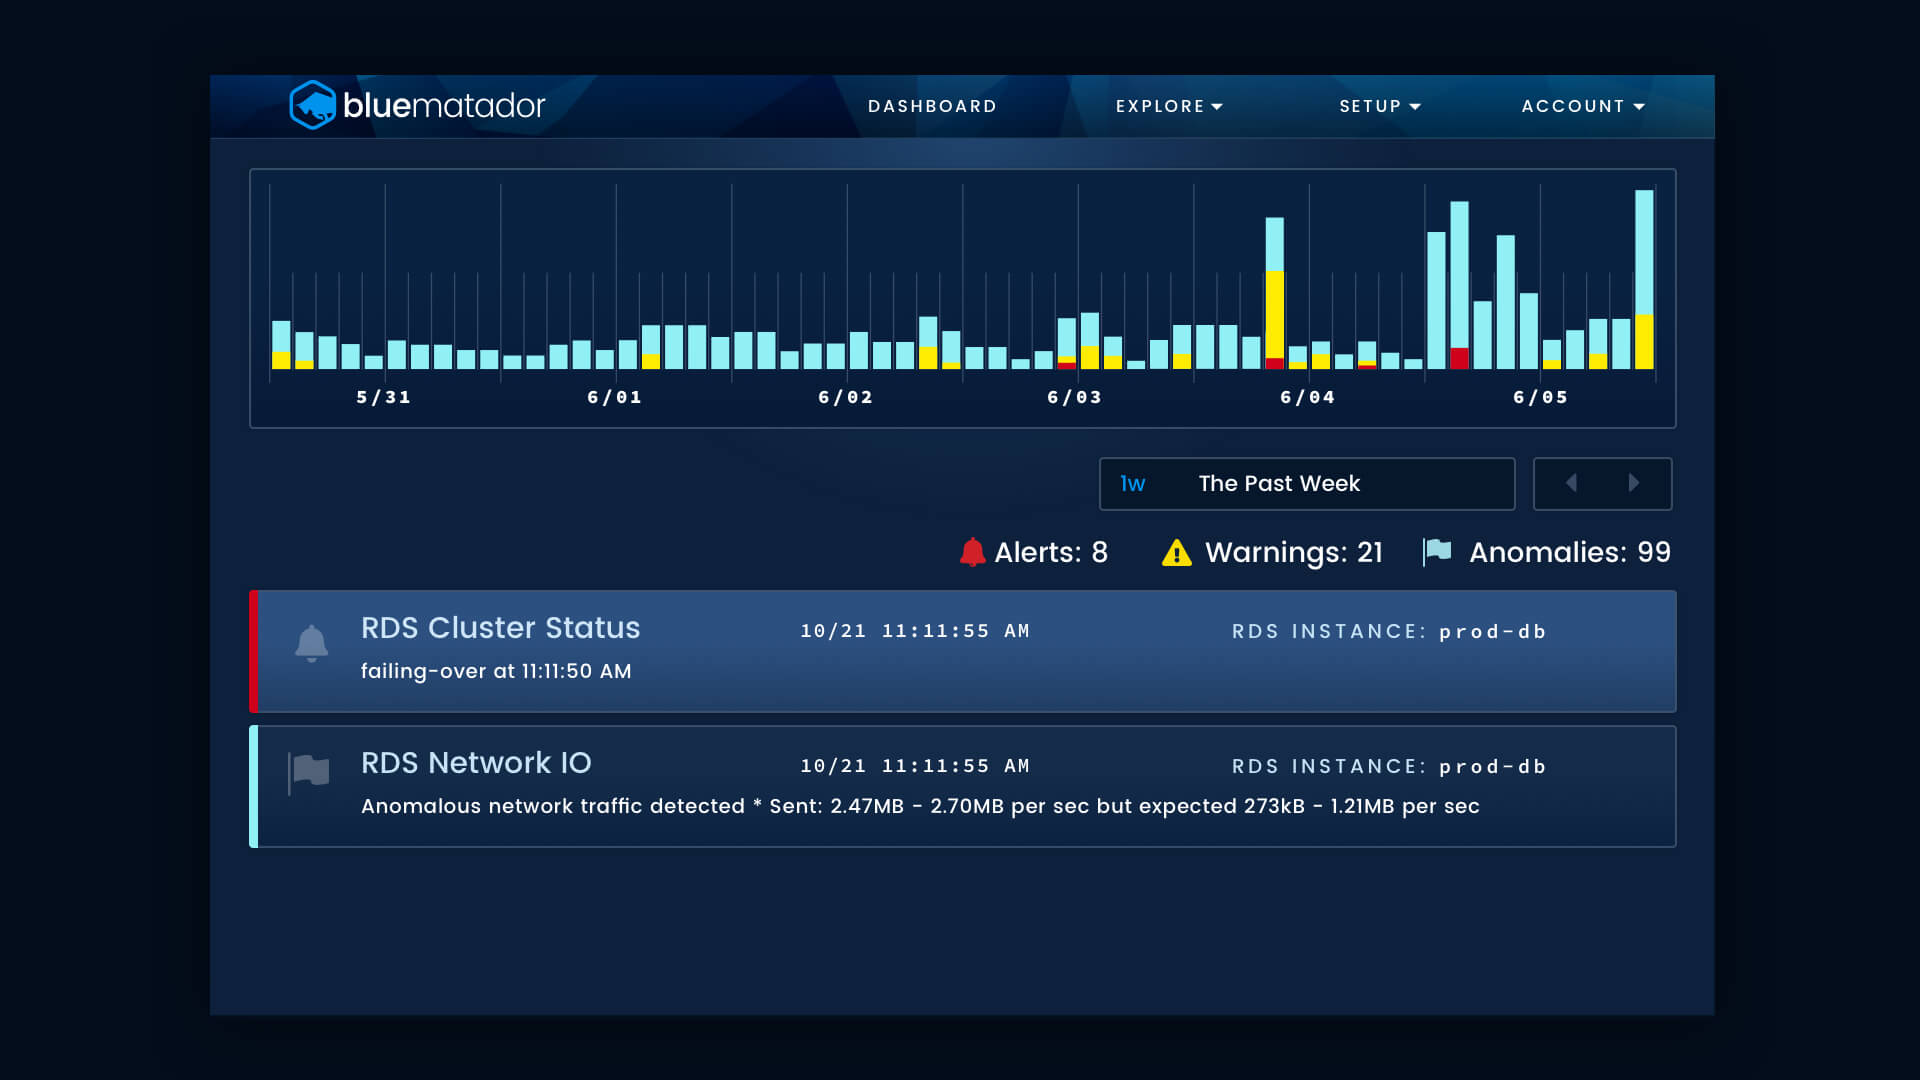
In addition, Blue Matador automatically creates events using machine learning with a dash of heuristics so you know when something requires your attention. These events are automatically triaged as Alerts, Warnings, and Anomalies to reflect the severity of the event.
Integrating Blue Matador with Amazon RDS
Amazon RDS is one of the AWS services that are automatically monitored by Blue Matador when your AWS integration is set up. Creating an AWS integration with Blue Matador is extremely simple and requires just an IAM user or IAM role with read-only access to your AWS account. A full guide for setting up your AWS integration with Blue Matador can be found
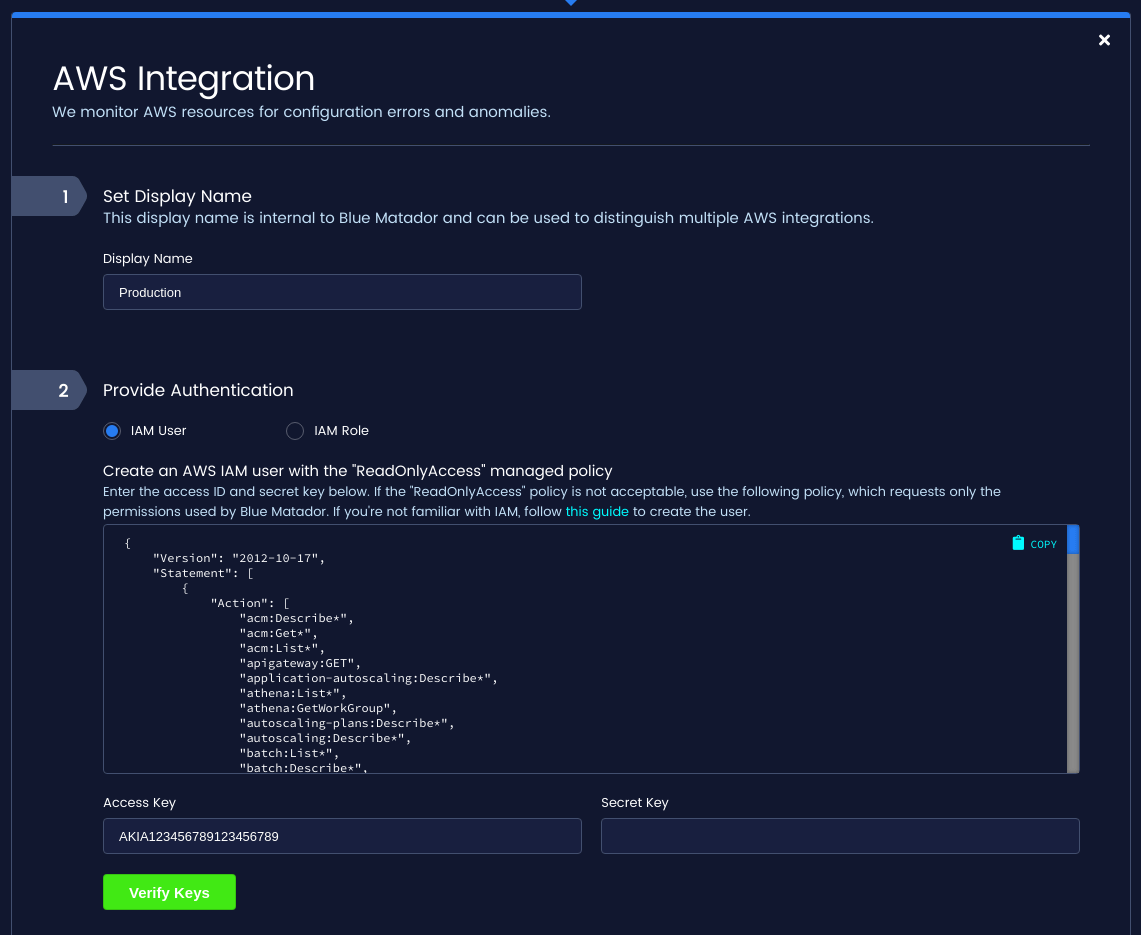
Once your AWS integration is created, Blue Matador will begin immediately collecting metadata and metrics for all of your RDS clusters and instances. The RDS API is used to list your resources in each AWS region. CloudWatch metrics are then gathered for each resource in each region of your AWS account, which are then fed into our metric pipeline. Blue Matador collects metrics for RDS on a 5-minute interval. This is done to balance getting up-to-date metadata and metrics with the fact that both CloudWatch and Amazon RDS rate-limit requests.
Monitoring RDS Health
Blue Matador monitors the following situations to help you keep up on the health of your RDS resources.
Cluster Status is the status of a database cluster. A healthy cluster reports its status as “available,” and any other status will cause an alert in Blue Matador. When your cluster is unavailable, your application may be unable to access the databases in the cluster.

Commit Latency measures the amount of latency for commit operations in RDS. Query latency can cause major performance issues in your application and is likely due to your application code making more updates than your database can handle.
Commit Throughput measures the number of commit operations made to your RDS instance each second. Executing more commits than expected can cause performance problems in your database.

Connections measures the number of connections to an RDS instance. Blue Matador creates an event when this number approaches the maximum number of allowed connections for your database type. Exceeding the limit will cause subsequent connections to be rejected.
CPU Utilization is the percentage of an instance’s CPU that is being consumed. High CPU utilization usually correlates with other metrics that are causing the increase in CPU usage.
Deadlocks measures the number of deadlocks occurring in your database as two or more transactions compete for a lock on database records. Repeated deadlocks can severely impact application performance because deadlocked queries require retries.

Disk Reads and Writes refer to the average throughput for reads and writes to your database instance’s disks. Anomalous disk IO can signal issues in application code, table modifications, or snapshotting.
Free Memory is the amount of unused memory available to your database instance. If free memory is exhausted, your database will begin using swap space, which is significantly slower than memory and will degrade your database performance.
Instance Status is the status of a database instance. AWS reports a variety of instance statuses, some of which are more severe than others. Blue Matador automatically triages these statuses.
Network Received and Sent refers to the amount of network traffic received by and sent to your database instance. These metrics are useful for correlation with other events, and may signal anomalous queries from your application.

RDS Events are event notifications created by AWS. Some of these events are trivial; others indicate major issues in your database. Blue Matador automatically triages RDS events based on severity.
Replica Lag measures how far an Aurora replica’s data is behind the data in the primary instance. If a replica is lagging behind the primary instance when the primary instance fails, it can result in data loss.
Select Latency measures the amount of latency for select operations in RDS. Query latency can cause major performance issues in your application and is likely due to your application code making more selects than your database can handle.
Select Throughput measures the number of select operations made to your RDS instance each second. Executing more selects than expected can cause performance problems in your database.
Correlating RDS Events
RDS events can easily be correlated with the other events generated by Blue Matador by using the Timeline. The Timeline page shows all of the events in your account in chronological order. Events are enriched with metadata, assigned a severity of Alert, Warning, or Anomaly, and can be filtered by any property on the event.
With all your events viewable in a single pane, you can correlate your RDS issues to EC2, Lambda, or any other events to quickly perform root cause analysis.
Conclusion
We’ve gone over how to set up Blue Matador to monitor RDS, what kinds of events Blue Matador automatically configures and maintains, and how these events can be used to troubleshoot your entire system.
In addition to our automated alerts for RDS, Blue Matador automatically creates alerts for other AWS services like ELB, Lambda, EC2, and more. In fact, Blue Matador has hundreds of alerts for AWS, Azure, and Kubernetes that are automatically set up and dynamically maintained taking the time and toil out of monitoring.


