
![]()
Amazon CloudFront is a CDN that allows you to serve content from edge locations without having to actually stand up infrastructure around the world. However, since it’s a managed service, you have less visibility with traditional monitoring tools. As such, it becomes even more important to take advantage of the available monitoring tools in AWS. In this post, we’ll explain how to use CloudWatch to monitor CloudFront and what is important to watch.
How to Use CloudWatch Metrics with CloudFront
CloudFront publishes metrics to CloudWatch minutely; looking for abnormalities and limits in these metrics is a great way to spot issues in your services and clusters. However, some metrics are better indicators of service or cluster health than others. In this section, we’ll discuss the metrics to monitor. But first, monitoring many of these metrics requires looking for anomalies specific to your instances, so we’ll explain how to do so in CloudWatch.
Anomaly Detection in CloudWatch
CloudWatch recently released Anomaly Detection in alpha preview. Their implementation exposes an upper and lower band of what is considered normal for a metric, and allows you to alert off how much the metric exceeds the threshold. Exposing these two values means that you’ll be charged for two metrics in CloudWatch.
If you don’t want to pay for anomaly detection, you’ll have to use averages to approximate it. To do so, you’ll want to look at a week of data for a metric and then determine the average high and low. Create a 10% window above the average high and below the average low and you have a good threshold for what looks healthy for your application. However, it should be noted that this method will not account for any time based variation (such as reduced traffic on weekends).
Requests
The Requests metric measures the number of requests made to your distribution. Major changes in this metric can signal issues in your application, such as errors in clients calling the distribution. To monitor Requests, create a CloudWatch alarm on the Sum statistic looking for anomalies using your chosen method.
BytesDownloaded
The BytesDownloaded metric measures the number of bytes downloaded from your distribution. This metric covers many of the same situations as Requests, but can also catch issues where the number of requests stay the same, but the amount of data sent in responses has changed. To monitor BytesDownloaded, create a CloudWatch alarm on the Sum statistic looking for anomalies using your chosen method.
4xxErrorRate
4xxErrorRate is the percentage of responses in the 4xx range. A spike in this metric could suggest a changed API or moved resource resulting in bad requests or auth issues. Create a CloudWatch alarm for when the Average statistic for when this metric exceeds 10%.
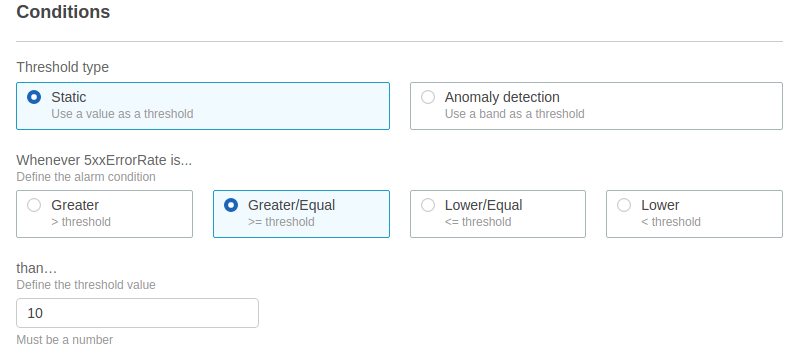
5xxErrorRate
5xxErrorRate measures the percentage of responses in the 5xx range. If your distribution is backed by servers and this metric spikes, you likely have issues affecting your servers’ ability to respond to requests. To monitor 5xxErrorRate, create a CloudWatch alarm for when the Average statistic for when this metric exceeds 10%.
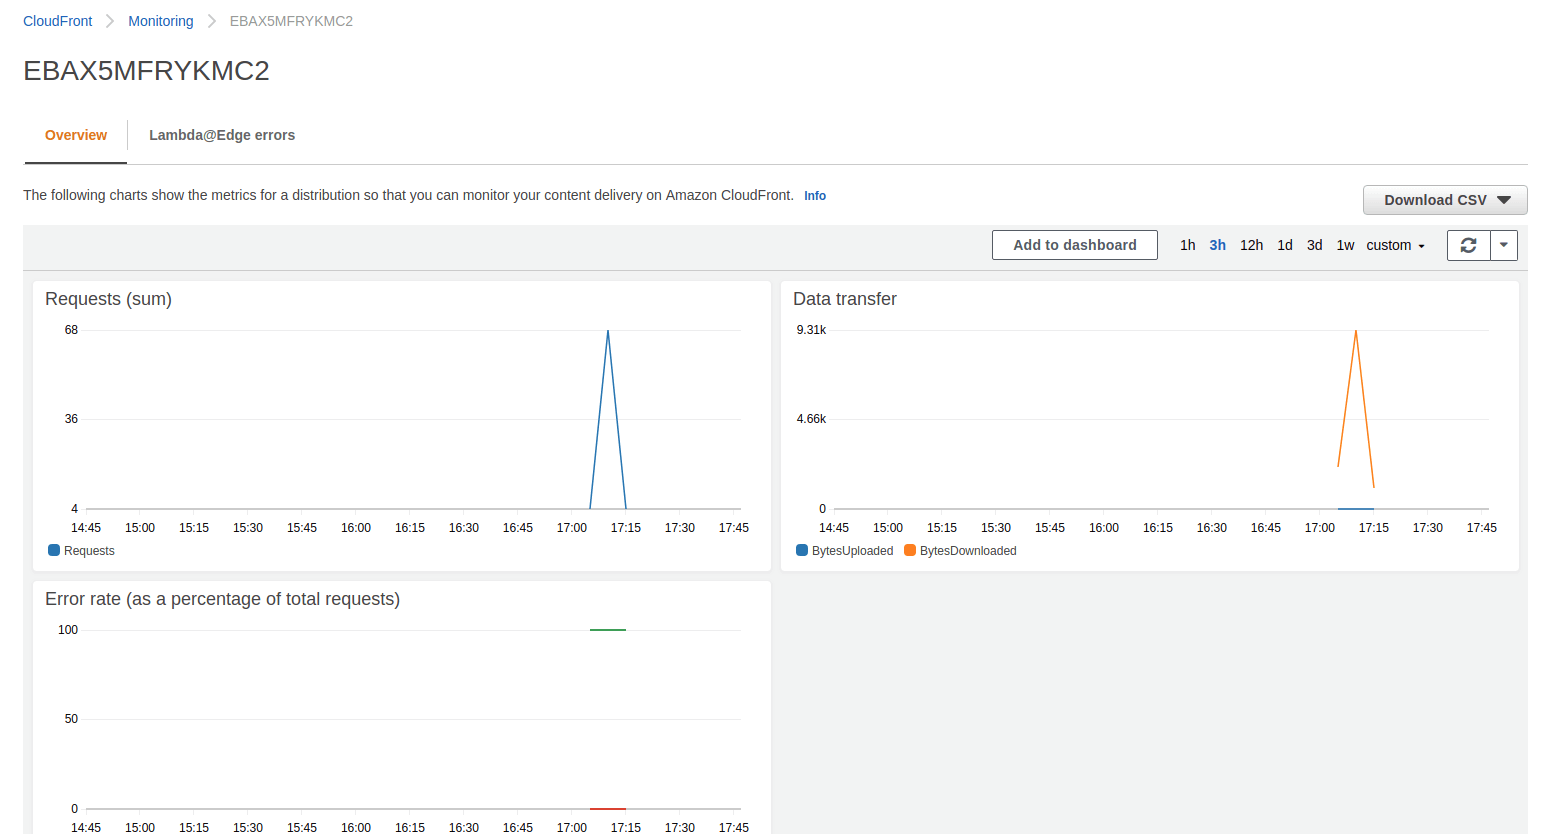
How to View CloudWatch Metrics for CloudFront
CloudWatch metrics for CloudFront can be viewed normally through the Metrics portion of CloudWatch, but it is also possible to use the Monitoring section in the CloudFront console. Choose the distribution to see several metric graphs describing its health.
How to Create CloudWatch Alarms for CloudFront
Now that we’ve determined which metrics to monitor, let’s talk about how to create CloudWatch alarms on those metrics. CloudWatch alarms are created from the CloudWatch console.
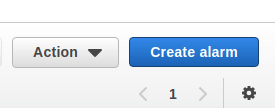
- Click on Create Alarm.
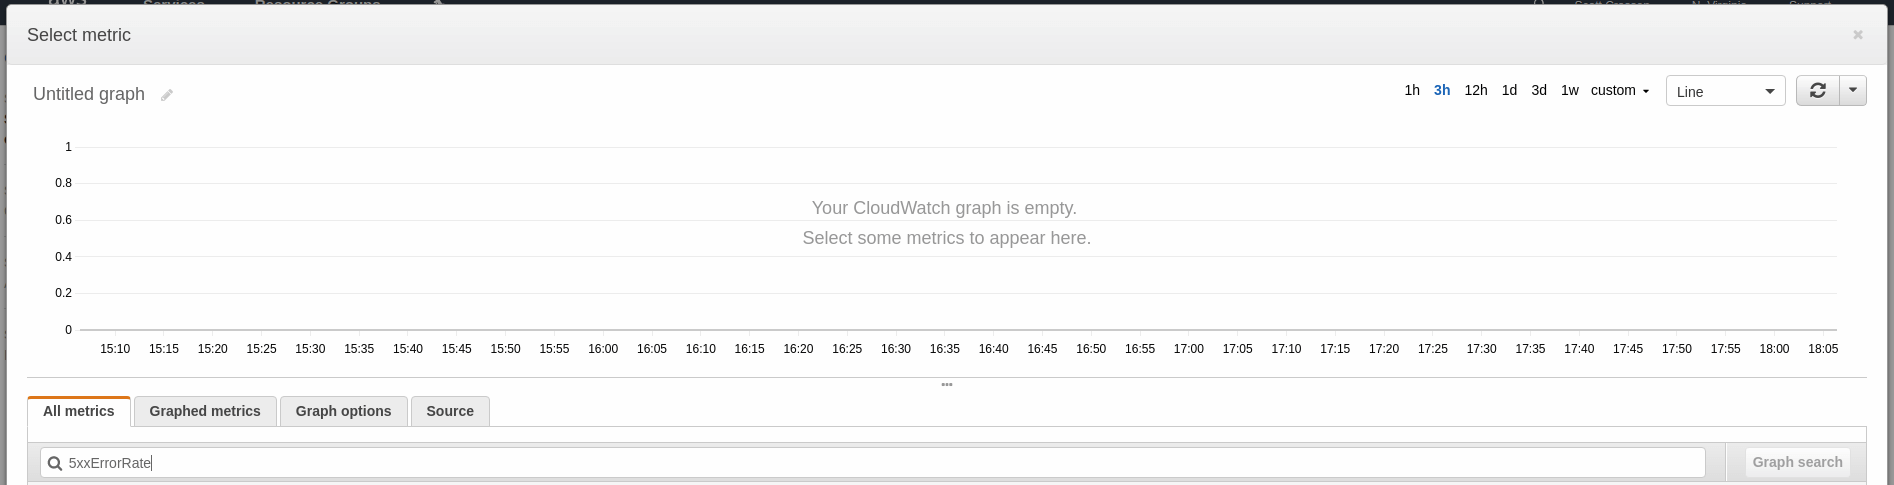
- Click on Select Metric and type the name of the metric into the search box.
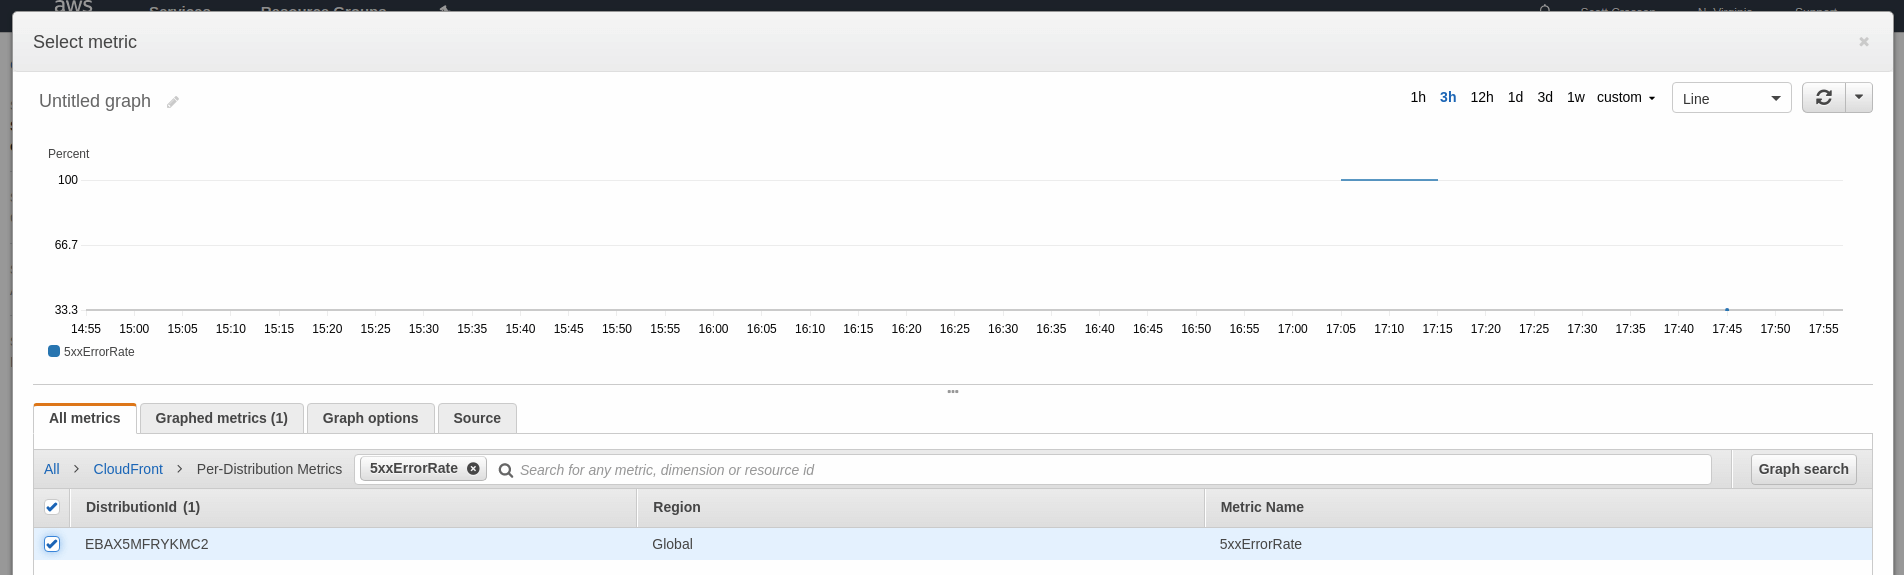
- Choose the metric for the service you’re going to monitor (under CloudFront > Per-Distribution Metrics)
- Click Select Metric.
- Configure your thresholds. You can use the thresholds described earlier in this article for each metric.
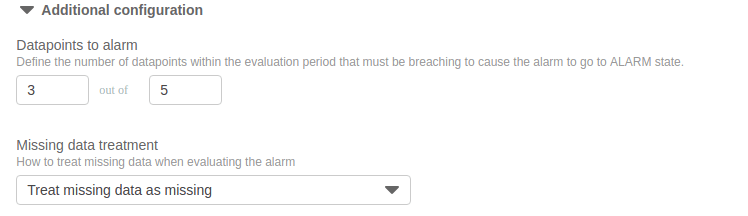
- Click on Additional Settings to choose how many datapoints to alarm on and what to do when data is missing (we recommend ignoring missing data and just keeping the previous state to keep alerts from flapping).
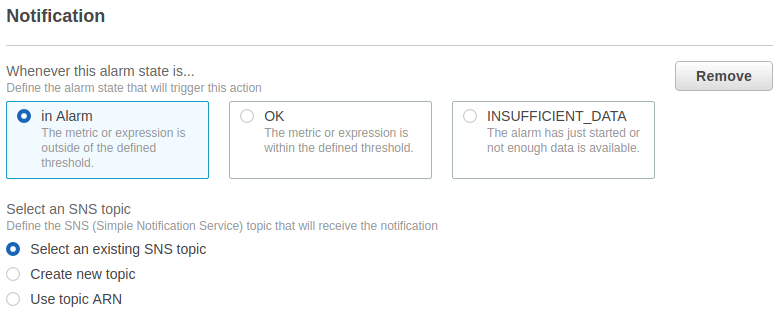
- Click Create Alarm.
Unfortunately, since CloudWatch only supports creating an alarm on a single metric, you’ll have to repeat the whole process for each service and metric combination. This can get incredibly time consuming and tedious.
Next Steps
Now you know how to monitor Amazon CloudFront using CloudWatch. However, it can be error prone and tedious to set up CloudWatch monitoring for all your distributions (and remembering to do it for distributions you create in the future is tough!). Even after you get your alarms set up, your distributions will continue to change, so expect to spend time tweaking thresholds.
Instead, take the manual work out of monitoring your distributions and use Blue Matador’s automatic setup to effortlessly watch for anomalies and errors within Amazon CloudFront without any configuration. This is especially important in a system like CloudFront, where monitoring depends heavily on anomaly detection. Get started on automatic alerting with Blue Matador now!


