
![]() Amazon DynamoDB is a key-value and document database that allows you to easily scale to huge numbers of records with single digit millisecond performance. However, since it’s a managed service, you have less visibility with traditional monitoring tools. As such, it becomes even more important to take advantage of the available monitoring tools in AWS. In this post, we’ll explain how to use CloudWatch to monitor DynamoDB and what is important to watch.
Amazon DynamoDB is a key-value and document database that allows you to easily scale to huge numbers of records with single digit millisecond performance. However, since it’s a managed service, you have less visibility with traditional monitoring tools. As such, it becomes even more important to take advantage of the available monitoring tools in AWS. In this post, we’ll explain how to use CloudWatch to monitor DynamoDB and what is important to watch.
How to Use CloudWatch Metrics with DynamoDB
DynamoDB publishes a host of metrics to CloudWatch and looking for abnormalities and limits in these metrics is a great way to spot issues in your tables. However, some metrics are better indicators of database health than others. In this section, we’ll discuss the metrics to monitor.
UserErrors
The UserErrors metric is incremented each time DynamoDB responds with a 400 HTTP error. Causes for this include invalid query parameters, trying to access a table or index that does not exist, or permissions errors. As such, any nonzero value for this metric represents an actionable issue. When you detect UserErrors are nonzero, check for any code releases or config changes that might have broken your queries.
To monitor UserErrors, create a CloudWatch Alarm to alert you whenever the Sum aggregation of this metric is greater than 0. Be aware that this metric is found under the Account Metrics section of DynamoDB metrics as they are not associated with a particular table.
SystemErrors
The SystemErrors metric is incremented each time DynamoDB responds with a 500 HTTP error. This metric means that the DynamoDB service is experiencing internal errors, which can be correlated with issues you are seeing in the rest of your application. Your application should be designed to retry requests to DynamoDB with exponential backoff to handle this situation.
When monitoring SystemErrors, you should create a CloudWatch alarm whenever SystemErrors is nonzero, but these alarms should be more informational, and not sent to your oncall team. That’s because consistent SystemErrors are useful to know about so you can handle the results in the rest of your application, but are not directly actionable. Instead, your application should be designed to retry calls to DynamoDB.
ConsumedReadCapacityUnits & ConsumedWriteCapacityUnits
DynamoDB tables are configured with a certain number of Read Capacity Units and Write Capacity Units that are consumed whenever you read from or write to your table. When you consistently exceed either configured amount, your request will be throttled. As such, it’s important to monitor the amount of RCU and WCU you are using to minimize throttling.
To do so, set CloudWatch alarms for ConsumedReadCapacityUnits and ConsumedWriteCapacityUnits when their Average aggregation is greater than than 80% of your provisioned limit for more than 10 datapoints. This will allow you to determine that you are consistently close to the limit and give you time to provision more RCU or WCU as needed. Additionally, CloudWatch is unable to detect when you add more provisioned RCUs or WCUs, so you’ll have to update your alarms if you ever change your capacity.
If you have set up autoscaling with DynamoDB, you will have already created CloudWatch alarms that result in scaling RCU or WCU.
ThrottledRequests
ThrottledRequests is incremented any time any part of a request to a table is throttled. This metric is a good catchall for throttling, as it encompasses both reads and writes. This metric is particularly important to monitor, as any throttle potentially represents a failure in your application or an inability to save data. For a detailed explanation of throttling in DynamoDB and how to troubleshoot it, refer to our guide on the subject.
Despite its importance, monitoring ThrottledRequests is not as simple as creating an alert for any nonzero value. Because of the way DynamoDB partitions your data, a small number of throttle events (where part of a batch request fails, but not the whole request) are normal, and your application should be able to simply retry the events that failed.
Therefore, to monitor ThrottledRequests, you’ll be looking for anomalies. Because CloudWatch doesn’t support anomaly detection, you’ll have to use averages to find issues. To do so, you’ll want to look at a week of data for each metric and then determine the average high. Add 10% to the metric and you have a good threshold for what looks healthy for your application. Next, create a CloudWatch alarm on the Sum aggregation for the metric whenever ThrottledRequests exceeds the determined threshold for more than 5 datapoints. You’ll need to create alarms for each of the DynamoDB operations that you use in your application:
-
PutItem
-
DeleteItem
-
UpdateItem
-
GetItem
-
BatchGetItem
-
Query
-
BatchWriteItem
What about ReadThrottleEvents or WriteThrottleEvents?
ReadThrottleEvents and WriteThrottleEvents are normal occurrences in DynamoDB if you are using batch operations. Your application needs to be able to handle retries for individual events that fail in your batch operations. It seems like these would be good metrics to monitor, but it turns out that if either of these two metrics occur for a request, ThrottledRequests will also be incremented, but only once, making it a better indication of failing requests.
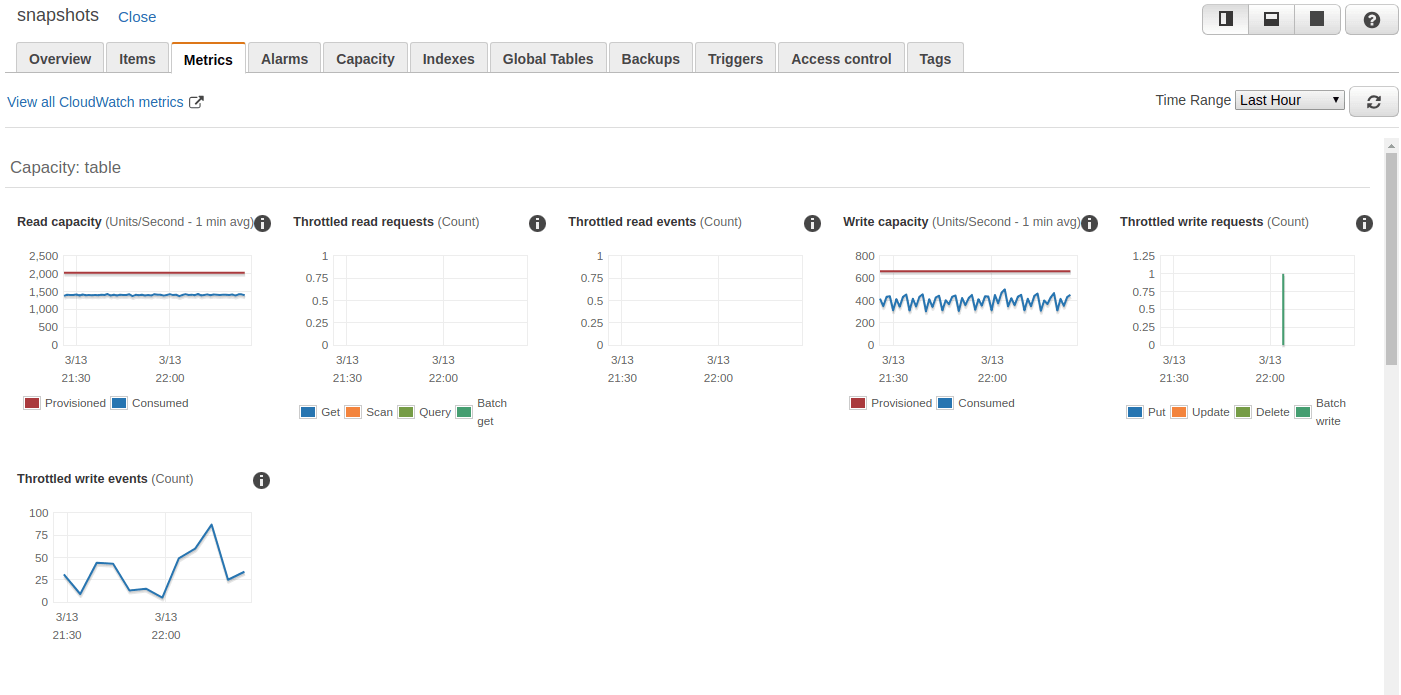
How to View CloudWatch Metrics for DynamoDB
CloudWatch metrics for DynamoDB can be viewed normally through the Metrics portion of CloudWatch, but it is also possible to use the Metrics tab in the DynamoDB Table console. This tab shows several metric graphs for each table.
How to Create CloudWatch Alarms for DynamoDB
Now that we’ve determined which metrics to monitor, let’s talk about how to create CloudWatch alarms on those metrics. CloudWatch alarms are created from the CloudWatch console.
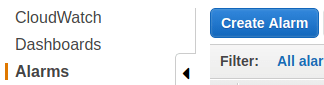
-
Click on Create Alarm.
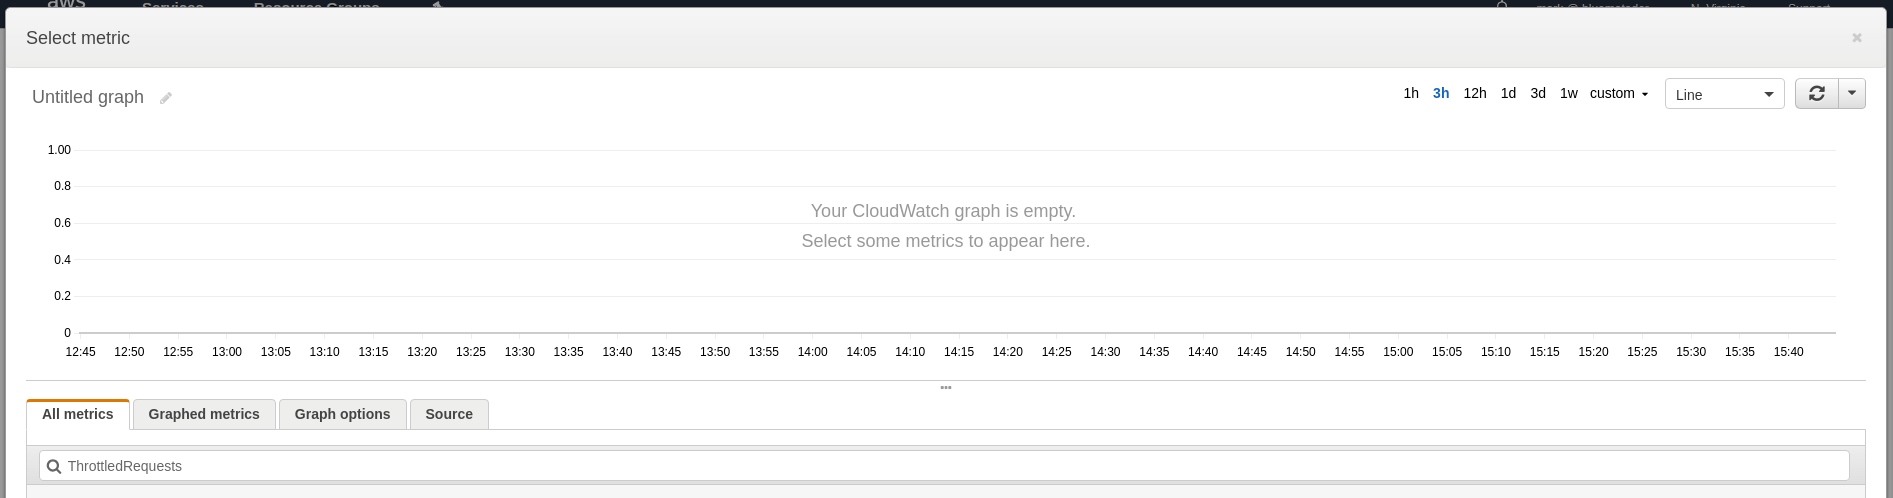
-
Click on Select Metric and type the name of the metric into the search box.
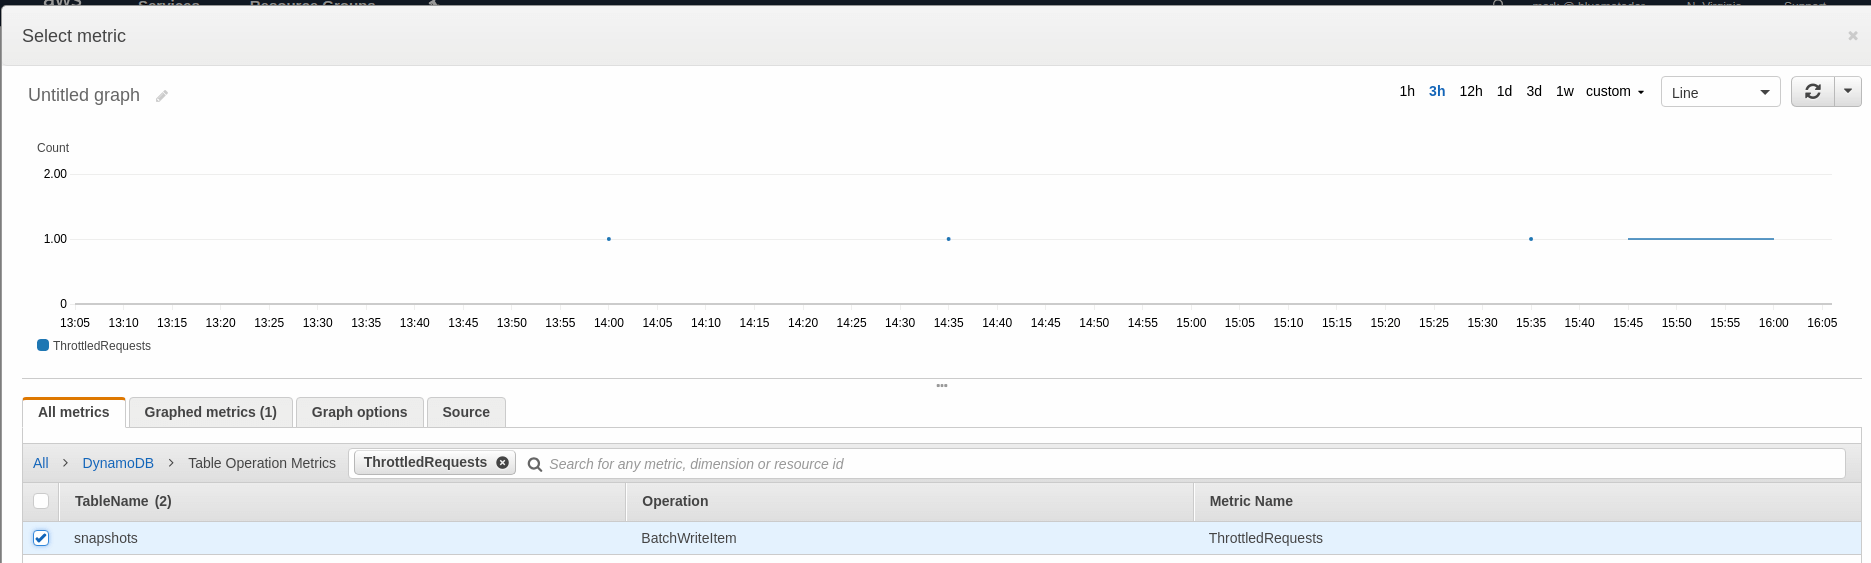
-
Choose the metric for the table you’re going to monitor and look at a 1 week graph to determine what your baselines are. Click Select Metric.
-
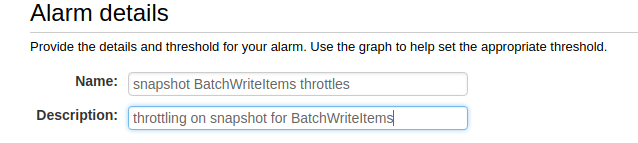
Name and describe your alarm.
-
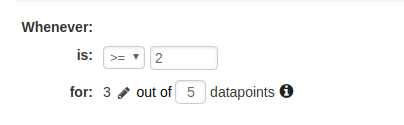
Configure your thresholds. You can use the thresholds described earlier in this article for each metric.
-
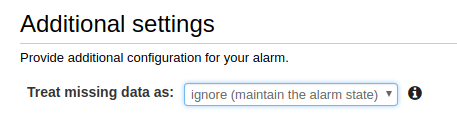
Choose what to do when data is missing (we recommend ignoring missing data and just keeping the previous state to keep alerts from flapping).
-
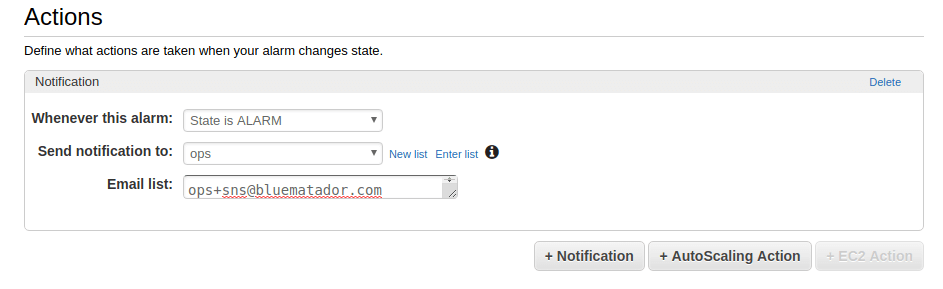
Set up notifications for the alarm.
-
Click Create Alarm.
Unfortunately, since your tables likely have different baselines, you’ll have to repeat the whole process for each table and metric combination. This can get incredibly time consuming and tedious.
Next Steps
Now you know how to monitor Amazon DynamoDB using CloudWatch. However, it can be error prone and tedious to set up CloudWatch monitoring for all your tables (and remembering to do it for tables you create in the future is tough!). Even after you get your alarms set up, your tables will continue to change, so expect to spend time tweaking thresholds.
Instead, take the manual work out of monitoring your tables and use Blue Matador’s automatic setup to effortlessly watch for anomalies and errors within DynamoDB without any configuration. Get started on automatic alerting with Blue Matador now!


