
![]() Amazon EBS allows you to provision storage volumes for your EC2 instances without having to actually manage physical hardware. However, since it’s a managed service, you have less visibility with traditional monitoring tools. As such, it becomes even more important to take advantage of the available monitoring tools in AWS. In this post, we’ll explain how to use CloudWatch to monitor EBS and what is important to watch.
Amazon EBS allows you to provision storage volumes for your EC2 instances without having to actually manage physical hardware. However, since it’s a managed service, you have less visibility with traditional monitoring tools. As such, it becomes even more important to take advantage of the available monitoring tools in AWS. In this post, we’ll explain how to use CloudWatch to monitor EBS and what is important to watch.
How to Use CloudWatch Metrics with EBS
EBS publishes a host of metrics to CloudWatch and looking for abnormalities and limits in these metrics is a great way to spot issues in your volumes. However, some metrics are better indicators of volume health than others. In this section, we’ll discuss the metrics to monitor. But first, monitoring many of these metrics requires looking for anomalies specific to your volumes, so we’ll explain how to do so in CloudWatch.
Approximating Anomaly Detection in CloudWatch
Because CloudWatch doesn’t support anomaly detection, you’ll have to use averages to find issues. To do so, you’ll want to look at a week of data for a metric and then determine the average high and low. Create a 10% window above the average high and below the average low and you have a good threshold for what looks healthy for your application. However, it should be noted that this method will not account for any time based variation (such as reduced traffic on weekends).
A Note about Volume Types
EBS has the following volume types:
-
General Purpose SSD (gp2)
-
Provisioned IOPS SSD (io1)
-
Throughput Optimized HDD (st1)
-
Cold HDD (sc1)
Some metrics are not available based on volume type. We will indicate that this is the case if applicable in each metric’s section.
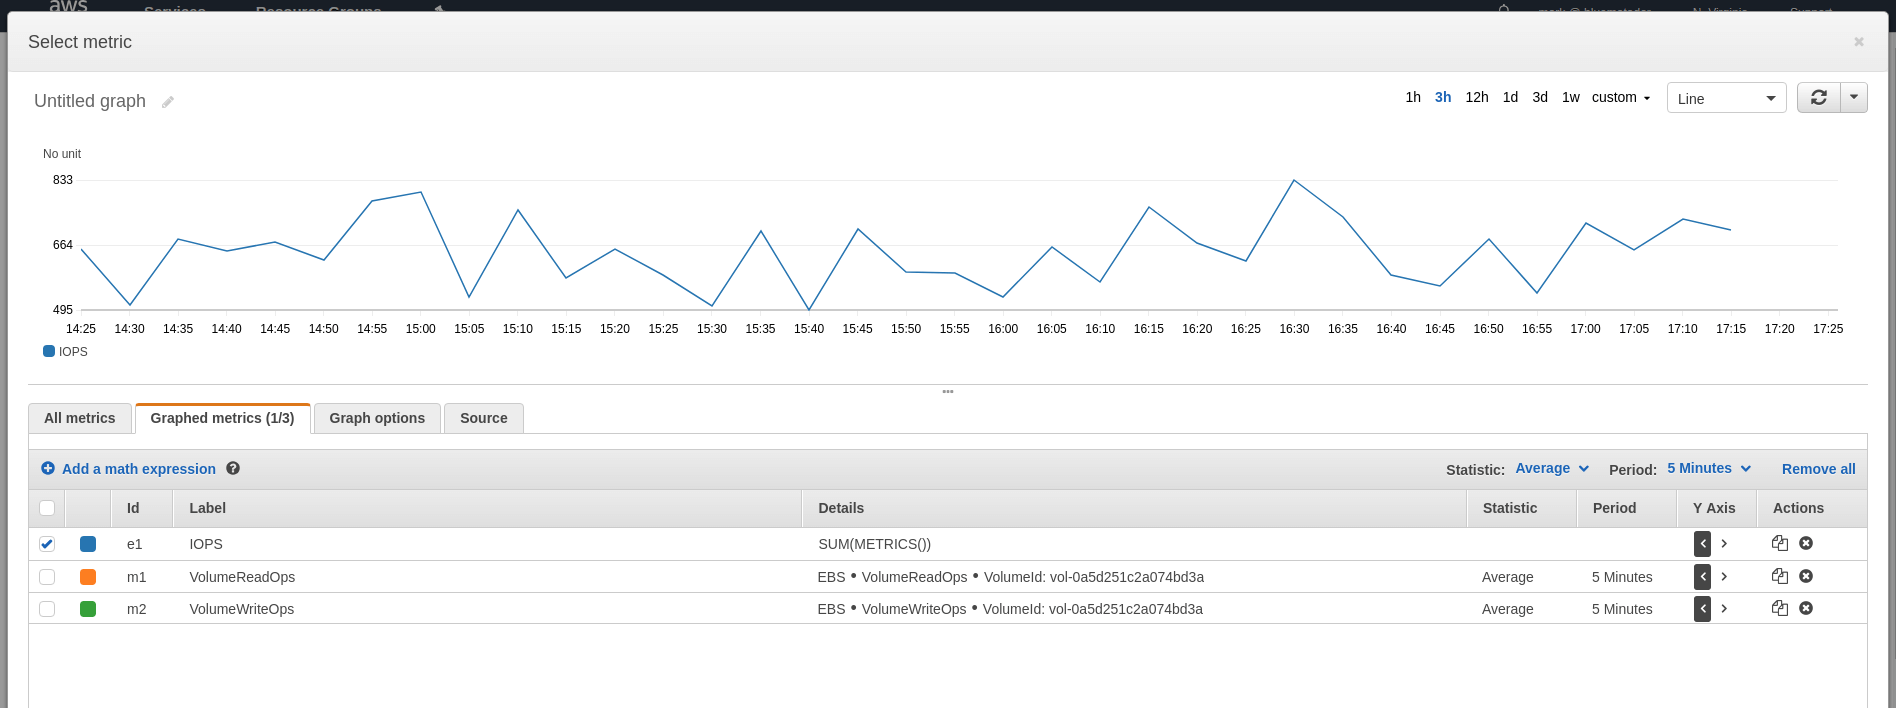
VolumeReadOps & VolumeWriteOps
VolumeReadOps and VolumeWriteOps measure the number of read and write operations on a volume. In most cases, it’s probably not valuable to monitor these metrics for anomalies, as disk reads can be a little spikey. However, if the volume is attached to a cache, disk access should be infrequent, so you should create a CloudWatch alarm on the Sum aggregation using the method described in the anomaly detection section.
Otherwise, you’ll want to create a CloudWatch alarm to alert you if you are approaching the IOPS limit for your volume type. To do so, first find the IOPS limit for your volume on this page. Next, when choosing the metric for your alarm, create a Math Expression that sums the VolumeReadOps and VolumeWriteOps and then select only the result. Then set your threshold for when that combination is greater than 90% of your limit.
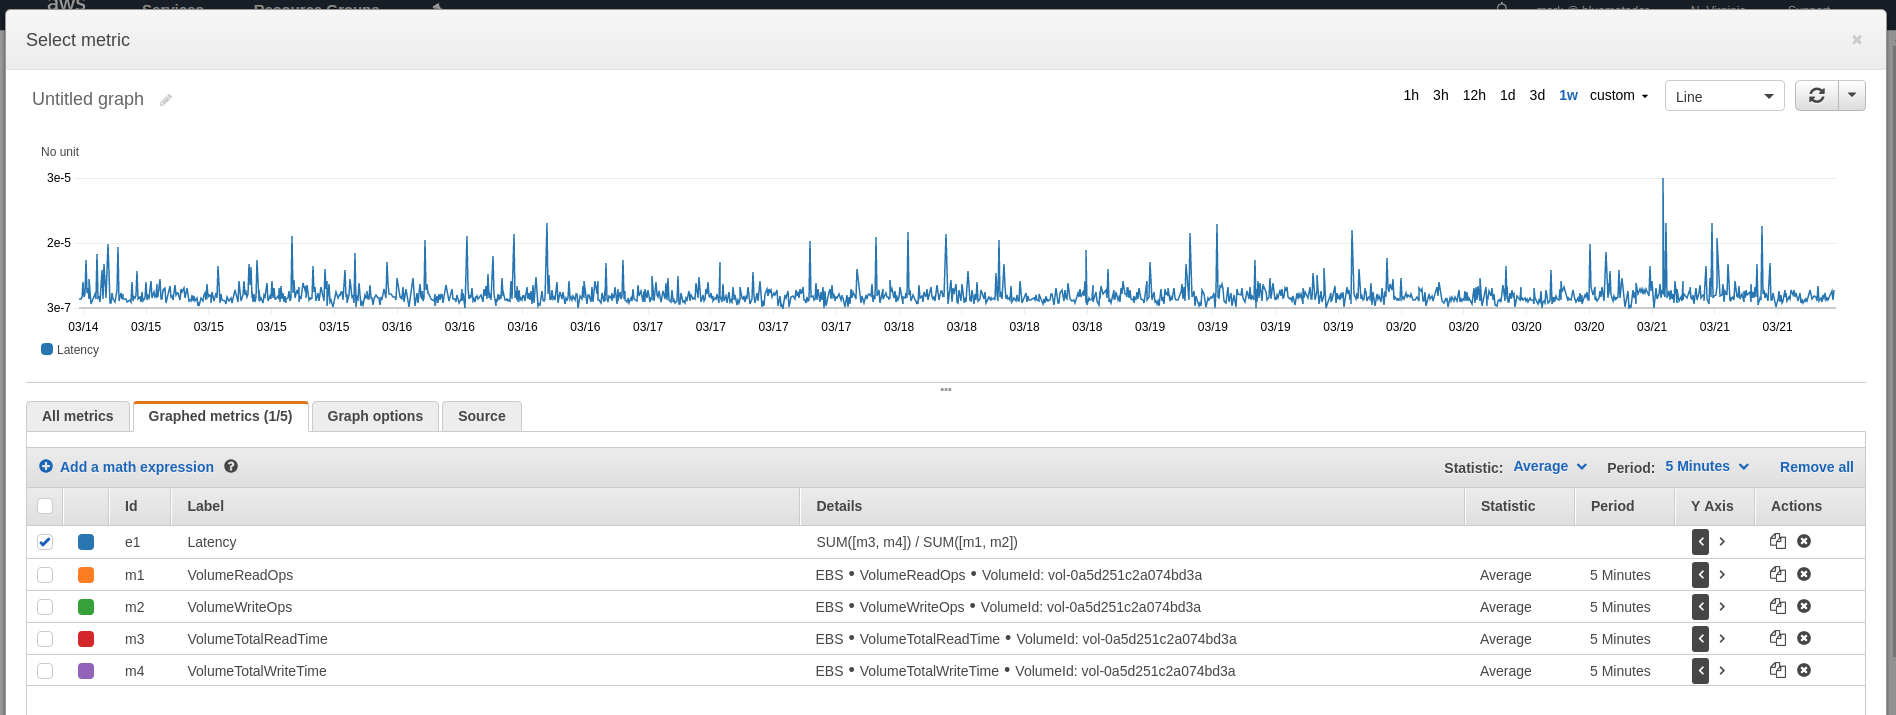
VolumeTotalReadTime & VolumeTotalWriteTime
By themselves, VolumeTotalReadTime and VolumeTotalWriteTime are not particularly valuable, but can be used to calculate the disk latency for your volume. Latency is calculated with the following formula:
(VolumeTotalReadTime + VolumeTotalWriteTime) / (VolumeReadOps + VolumeWriteOps)
To monitor latency, you should create a CloudWatch alarm by using the anomaly detection method described earlier in this post on your calculated latency metric, using Sum for all metrics in the formula.
VolumeQueueLength
VolumeQueueLength measures the number of disk operations queued. When this metric spikes, access to your disk will slow and your application performance may suffer. However, monitoring your volume for a queue size greater than 0 is not desirable, as it suggests you expect your volume to sit idle for much of its time. Instead, create a CloudWatch alarm on VolumeQueueLength with the Average aggregation using the anomaly detection method we described earlier in the post.
VolumeThroughputPercentage
VolumeThroughputPercentage measures the percent of the provisioned IOPS for your volume that your volume is actually getting. AWS expects volumes to be within 10% of their provisioned limit for 99.9% of the year, but it can be helpful to monitor this metric for correlation with other issues you are seeing in your application. To do so, create a CloudWatch alarm on VolumeThroughputPercentage on the Average aggregation for values less than 90% of your volume’s provisioned IOPS limit. Send this notification to a lower priority notification method.
This metric only applies to io1 volume types.
BurstBalance
Because gp2 volumes don’t have provisioned IOPS, they have a Burst Balance that allows them to temporarily do more operations. The BurstBalance metric measures the remaining percentage of the Burst Balance for your volume. Consistently using the Burst Balance is a sign that you need to upgrade your volume and you should monitor for this condition. Create a CloudWatch alarm on BurstBalance for the Average aggregation for values less than 25% that happen for more than 3 datapoints (5 minutes each).
This metric applies to gp2, st1, and sc1 volume types.
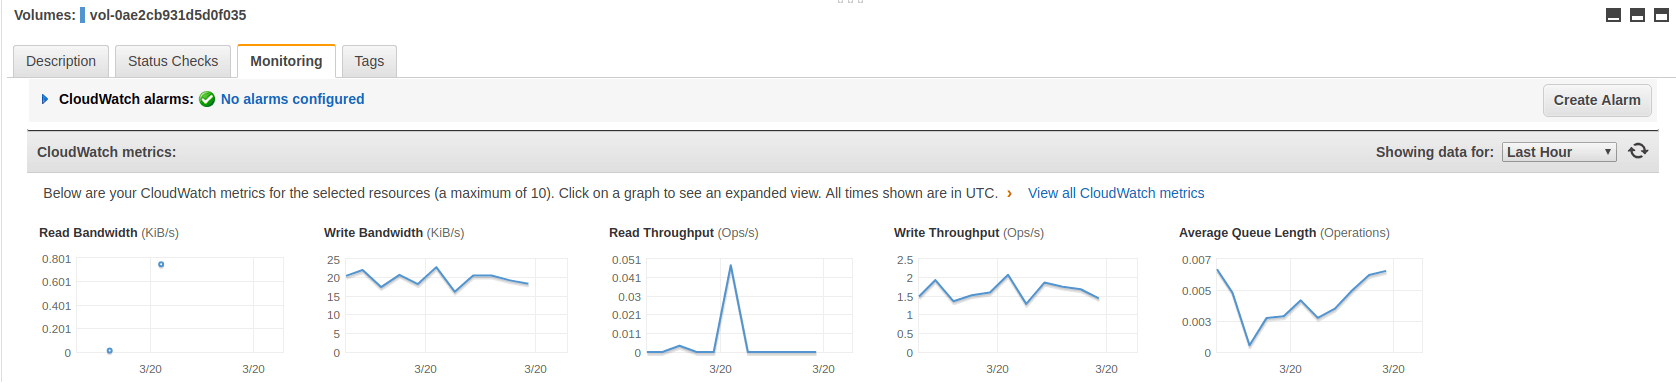
How to View CloudWatch Metrics for EBS
CloudWatch metrics for EBS can be viewed normally through the Metrics portion of CloudWatch, but it is also possible to use the Monitoring tab in the Volumes section of the EC2 console. This tab shows several metric graphs for each volume.
How to Create CloudWatch Alarms for EBS
Now that we’ve determined which metrics to monitor, let’s talk about how to create CloudWatch alarms on those metrics. CloudWatch alarms are created from the CloudWatch console.
-
Click on Create Alarm.
-
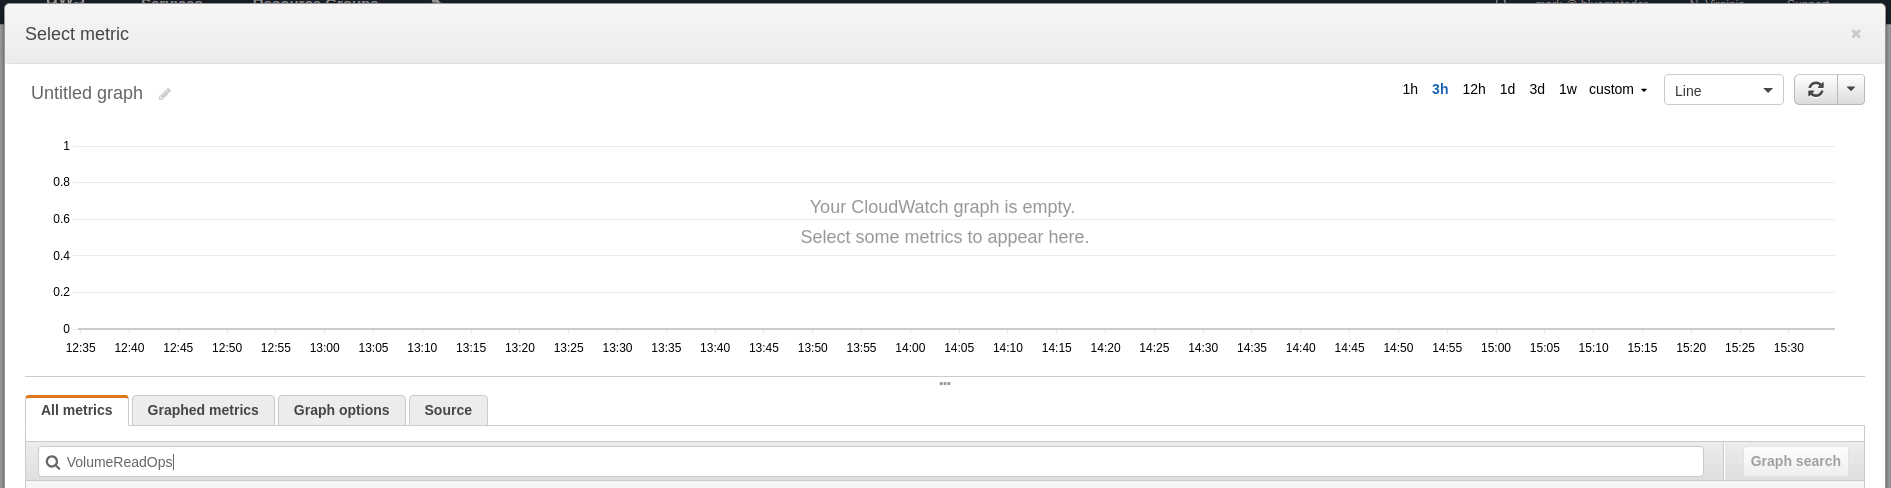
Click on Select Metric and type the name of the metric into the search box.
-
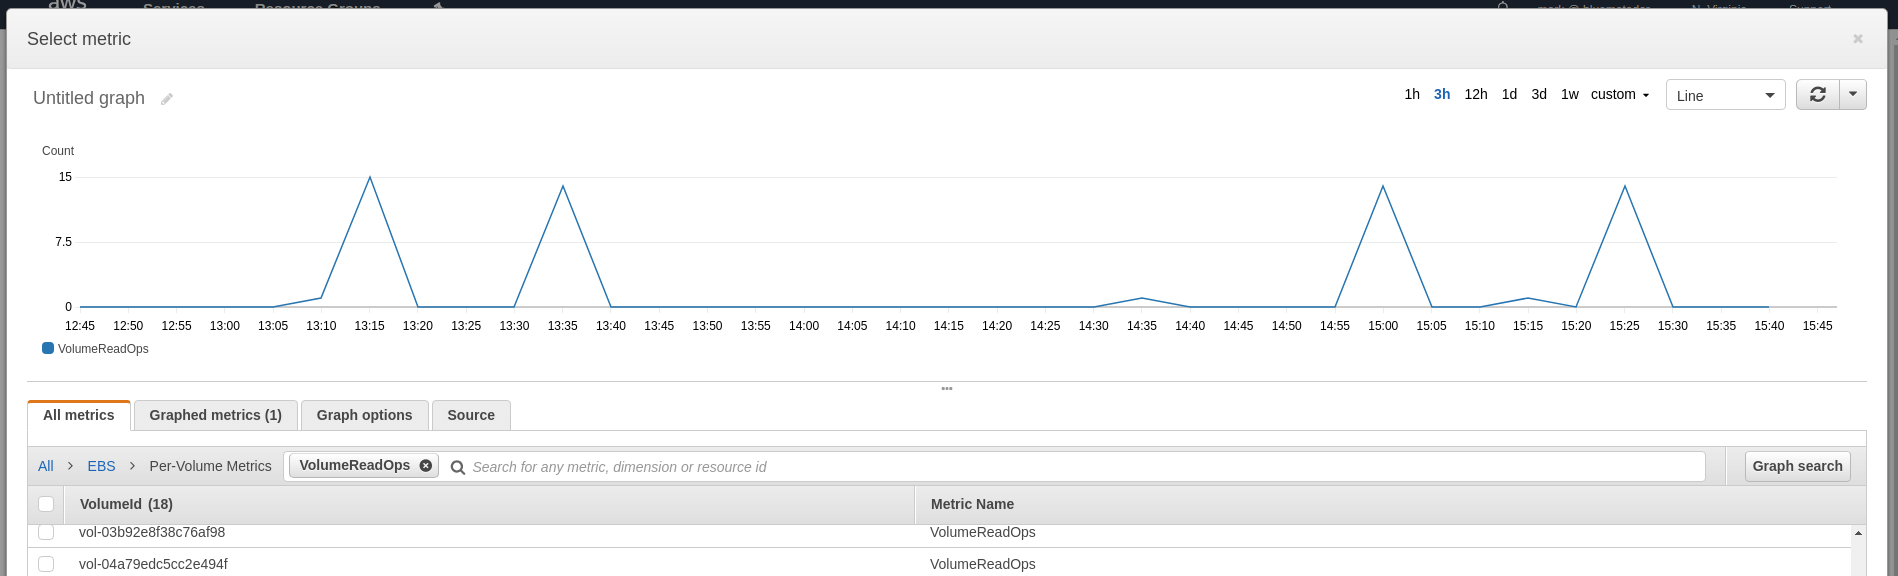
Choose the metric for the volume you’re going to monitor (under EBS > Per-Volume Metrics) and look at a 1 week graph to determine what your baselines are. Click Select Metric.
-
Name and describe your alarm.

-
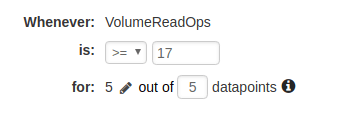
Configure your thresholds. You can use the thresholds described earlier in this article for each metric.
-
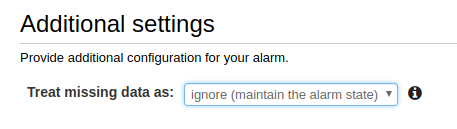
Choose what to do when data is missing (we recommend ignoring missing data and just keeping the previous state to keep alerts from flapping).
-
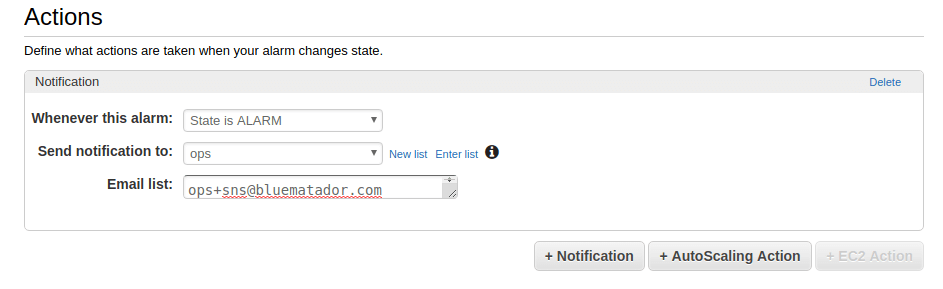
Set up notifications for the alarm.
-
Click Create Alarm.
Unfortunately, since CloudWatch only supports creating an alarm on a single metric, you’ll have to repeat the whole process for each volume and metric combination. This can get incredibly time consuming and tedious.
Next Steps
Now you know how to monitor Amazon EBS using CloudWatch. However, it can be error prone and tedious to set up CloudWatch monitoring for all your volumes (and remembering to do it for volumes you create in the future is tough!). Even after you get your alarms set up, your volumes will continue to change, so expect to spend time tweaking thresholds.
Instead, take the manual work out of monitoring your volumes and use Blue Matador’s automatic setup to effortlessly watch for anomalies and errors within Amazon EBS without any configuration. This is especially important in a system like EBS, where monitoring depends heavily on anomaly detection. Get started on automatic alerting with Blue Matador now!


