
![]() Amazon EC2 allows you to spin up servers for your application without having to actually manage physical hardware. However, since it’s a managed service, you have less visibility with traditional monitoring tools. As such, it becomes even more important to take advantage of the available monitoring tools in AWS. In this post, we’ll explain how to use CloudWatch to monitor EC2 and what is important to watch.
Amazon EC2 allows you to spin up servers for your application without having to actually manage physical hardware. However, since it’s a managed service, you have less visibility with traditional monitoring tools. As such, it becomes even more important to take advantage of the available monitoring tools in AWS. In this post, we’ll explain how to use CloudWatch to monitor EC2 and what is important to watch.
How to Use CloudWatch Metrics with EC2
EC2 publishes a host of metrics to CloudWatch and looking for abnormalities and limits in these metrics is a great way to spot issues in your instances. However, some metrics are better indicators of instance health than others. In this section, we’ll discuss the metrics to monitor. But first, monitoring many of these metrics requires looking for anomalies specific to your instances, so we’ll explain how to do so in CloudWatch.
Approximating Anomaly Detection in CloudWatch
Because CloudWatch doesn’t support anomaly detection, you’ll have to use averages to find issues. To do so, you’ll want to look at a week of data for a metric and then determine the average high and low. Create a 10% window above the average high and below the average low and you have a good threshold for what looks healthy for your application. However, it should be noted that this method will not account for any time based variation (such as reduced traffic on weekends).
A Note on Metric Granularity
By default, EC2 reports metrics to CloudWatch in 5 minute intervals. However, if you enable enhanced monitoring for an instance, you’ll be able to get metrics in 1 minute intervals (though there is an additional cost). If your application has higher performance requirements, it may be worth the money to get more data so you can react more quickly to changes in your application.
NetworkIn, NetworkOut, NetworkPacketsIn, & NetworkPacketsOut
A sharp increase or decrease in your instance’s network traffic is typically a good indication that the instance is unhealthy. It’s one of the best ways to detect unhealthy application behavior. The NetworkIn and NetworkOut metrics measure network traffic in bytes, while NetworkPacketsIn and NetworkPacketsOut measure traffic in number of packets. You should create CloudWatch alarms for each of these metrics using the anomaly detection method described earlier using the Average aggregation, looking for at least 2 data points of anomalous values (unless you’ve enabled enhanced metrics, in which case, you can look for 5 data points).
CPUCreditBalance
Some EC2 instance types support CPU Credit Balance, which allows them to temporarily burst above the baseline CPU threshold for the instance type. The CPUCreditBalance metric, as you might expect, measures the current CPU Credit Balance for an instance. This metric is a good one to monitor because when it begins to decrease, it is a sure sign that your instance is using too much CPU. To monitor it, create a CloudWatch alarm for when the Average aggregation goes below 25% of the instance type’s maximum CPU Credit Balance.
CPUUtilization
In CloudWatch, CPUUtilization measures the percent of total CPU being used by the instance. While anomalous CPUUtilization can signal issues in your instance, the metric also has a tendency to fluctuate and should be used more for correlation than detection of critical issues (CPUCreditBalance is a good way to monitor CPU issues for instance types with CPU credits). However, it can still be useful to create a CloudWatch alarm on the Average aggregation using the anomaly detection method and have notifications sent to a lower priority notification method.
StatusCheckFailed
The StatusCheckFailed metric measures if your instance has failed its Instance or System status checks in the last minute (it is available at minutely granularity). If your instance is failing its status checks for more than one datapoint, it is in serious trouble and needs to be troubleshooted immediately. To monitor SystemCheckFailed, create a CloudWatch alarm for the Sum aggregation for values greater than 0 for 2 data points.
DiskReadOps, DiskWriteOps, DiskReadBytes, & DiskWriteBytes
Like network traffic, disk IO is a good indication of the health of your instance. Unfortunately, EC2 measures disk metrics only for instance types that have instance storage. If your instance type has instance storage (in the table it will list the amount, and not just “EBS only”), you can follow the anomaly detection method described earlier to create CloudWatch alarms on the Average aggregation of each metric. Otherwise, stay tuned for our blog post on how to monitor EBS volumes with CloudWatch!
Keep in mind that these metrics only measure disk performance for instance storage, so even if your instance has instance storage, you will still have to monitor any additional EBS volumes you’ve attached to the instance. You will also need to use another solution to monitor actual disk space used on your file systems, as this metric is not available in CloudWatch.
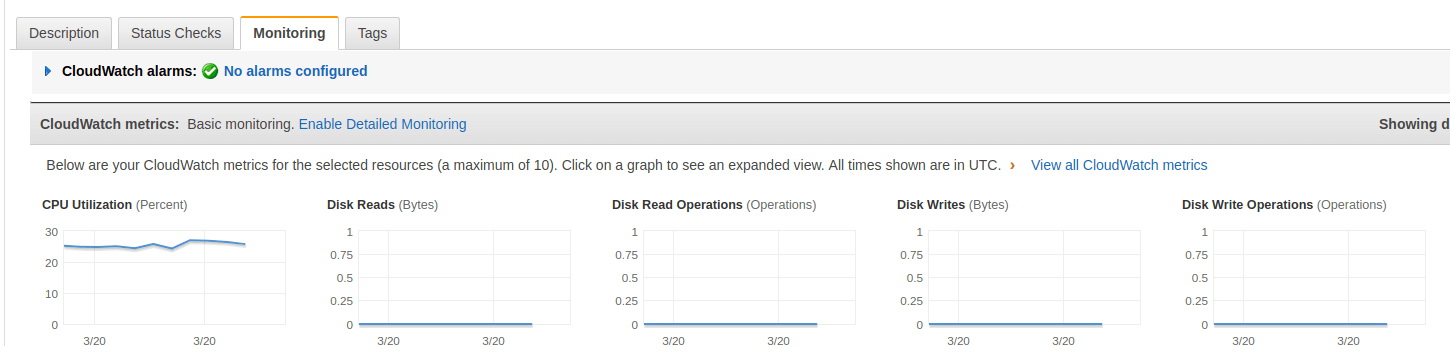
How to View CloudWatch Metrics for EC2
CloudWatch metrics for EC2 can be viewed normally through the Metrics portion of CloudWatch, but it is also possible to use the Monitoring tab in the Instances section of the EC2 console. This tab shows several metric graphs for each instance.
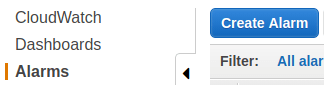
How to Create CloudWatch Alarms for EC2
Now that we’ve determined which metrics to monitor, let’s talk about how to create CloudWatch alarms on those metrics. CloudWatch alarms are created from the CloudWatch console.
-
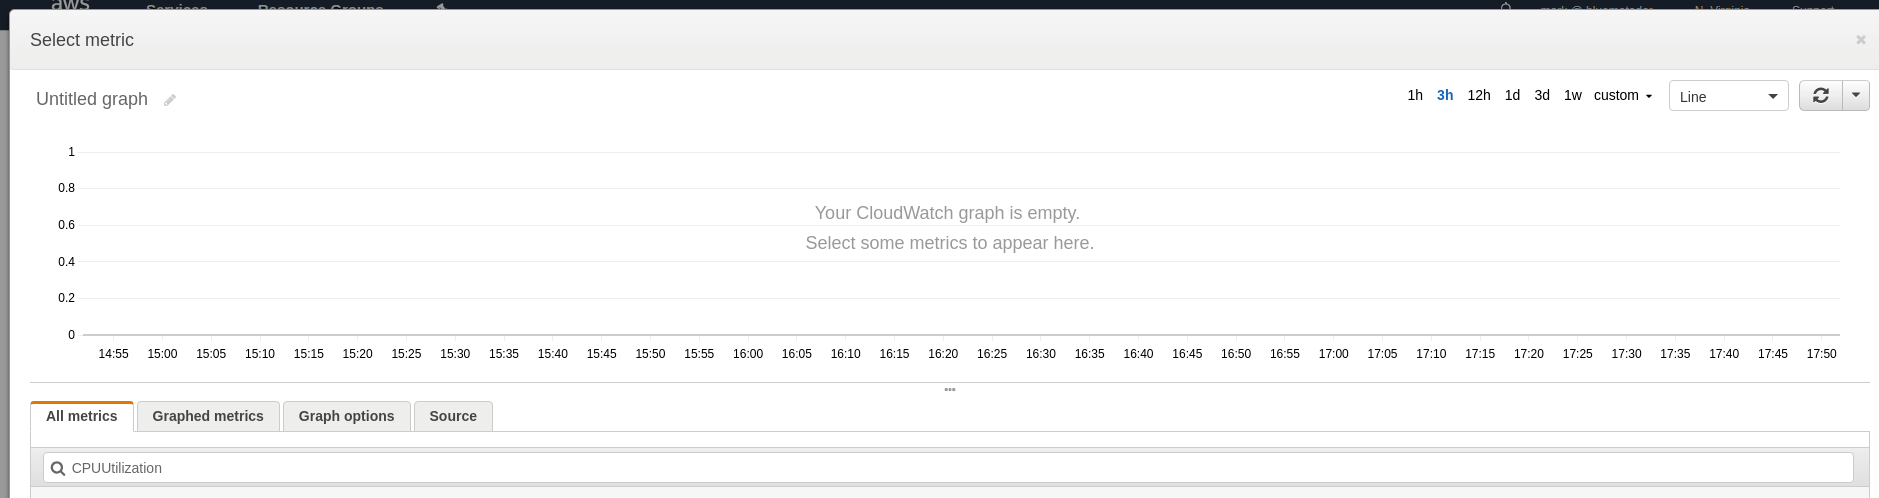
Click on Create Alarm.
-
Click on Select Metric and type the name of the metric into the search box.
-
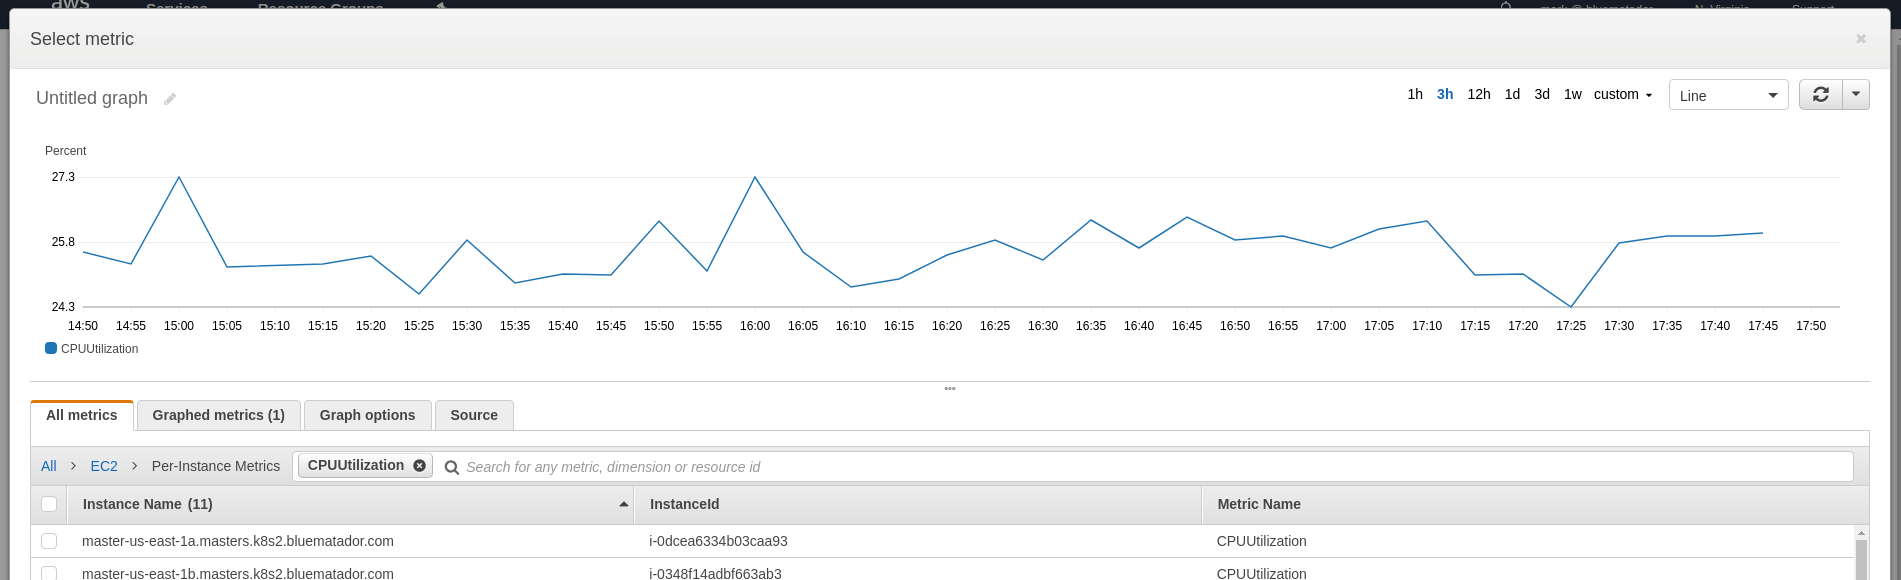
Choose the metric for the instance you’re going to monitor (under EC2 > Per-Instance Metrics) and look at a 1 week graph to determine what your baselines are. Click Select Metric.
-
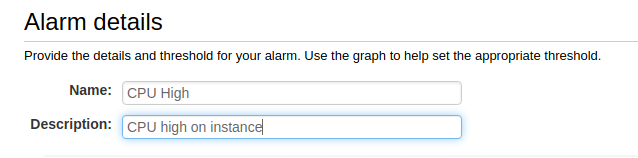
Name and describe your alarm.
-
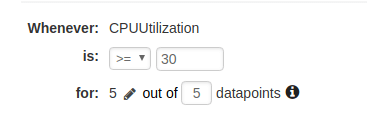
Configure your thresholds. You can use the thresholds described earlier in this article for each metric.
-
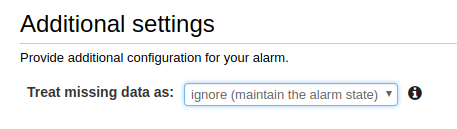
Choose what to do when data is missing (we recommend ignoring missing data and just keeping the previous state to keep alerts from flapping).
-
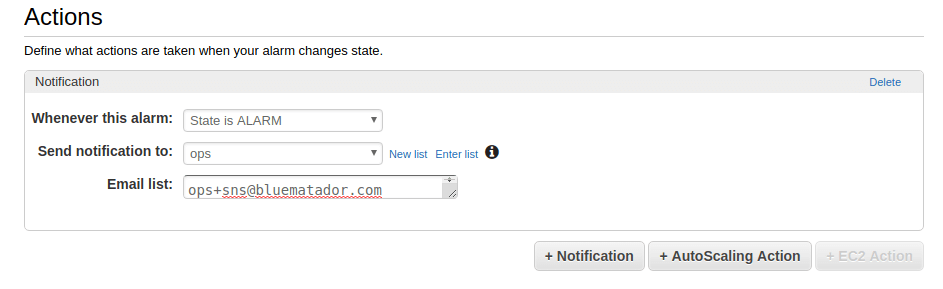
Set up notifications for the alarm.
-
Click Create Alarm.
Unfortunately, since CloudWatch only supports creating an alarm on a single metric, you’ll have to repeat the whole process for each instance and metric combination. This can get incredibly time consuming and tedious.
Next Steps
Now you know how to monitor Amazon EC2 using CloudWatch. However, it can be error prone and tedious to set up CloudWatch monitoring for all your instances (and remembering to do it for instances you create in the future is tough!). Even after you get your alarms set up, your instances will continue to change, so expect to spend time tweaking thresholds.
Instead, take the manual work out of monitoring your instances and use Blue Matador’s automatic setup to effortlessly watch for anomalies and errors within Amazon EC2 without any configuration. This is especially important in a system like EC2, where monitoring depends heavily on anomaly detection. Get started on automatic alerting with Blue Matador


