
![]()
Amazon ECS allows you to run Docker containers your application without having to actually manage physical hardware (or virtual hardware, in the case of the Fargate launch type). However, since it’s a managed service, you have less visibility with traditional monitoring tools. As such, it becomes even more important to take advantage of the available monitoring tools in AWS. In this post, we’ll explain how to use CloudWatch to monitor ECS and what is important to watch.
Enabling CloudWatch Metrics for ECS
There are two different launch types for ECS: EC2 and Fargate. With EC2, you manage the number and instance type of the virtual servers that your containers are running on. With Fargate, you let AWS schedule your containers for you. As such, if you’re using the EC2 launch type, you’ll have to check that the EC2 instances (called container instances in ECS parlance) are running at least version 1.4.0 of the container agent to get CloudWatch metrics. If you’re running containers with Fargate, CloudWatch metrics are automatically collected.
How to Use CloudWatch Metrics with ECS
ECS publishes metrics to CloudWatch and looking for abnormalities and limits in these metrics is a great way to spot issues in your services and clusters. However, some metrics are better indicators of service or cluster health than others. In this section, we’ll discuss the metrics to monitor.
CPU
When you configure tasks (containers) to run in ECS, you’ll specify the amount of CPU that the task will be reserving for its execution. This amount is what you expect the task to need. If actual usage is less than the reserved amount, you will be wasting CPU resources. If you exceed the amount, you may be able to burst above the reserved amount, but prolonged use will result in poor performance.
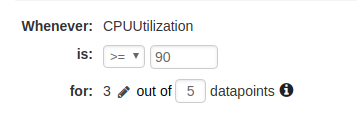
To combat this issue, monitor the CPUUtilization metric. This metric measures the percent of the reserved CPU that a service is actually using. Additionally, you should create a CloudWatch alarm for when the service uses more than 90% of its reserved CPU. Use the Average statistic to create the alarm.
If you are running your tasks on container instances, you will also have access to the CPUReservation metric, which measures the percent of your container instance cluster’s combined CPU that has been reserved by running tasks. This metric can help you know when you need to scale your cluster. To make sure you don’t end up running out of space for your tasks, create a CloudWatch alarm on CPUReservation for when the Average statistic exceeds 90%.
Memory
As with CPU, when you configure tasks, you’ll specify the amount of memory to reserve for it. However, unlike CPU, which is burstable, exceeding the reserved amount will cause your task to terminate. As such, you’ll definitely want to avoid this situation.
To do so, monitor the MemoryUtilization metric. This metric measure the percent of the reserved memory that a service is actually using. You should also create a CloudWatch alarm for when the Average statistic exceeds 90%.
If you are running tasks on container instances, there’s also the MemoryReservation metric to monitor. It measures the percent of your cluster’s combined memory that has been reserved by running tasks. This metric can help you know when to scale your cluster. To make sure you don’t end up running out of space for your tasks, create a CloudWatch alarm on MemoryReservation for when the Average statistic exceeds 90%.
How to View CloudWatch Metrics for ECS
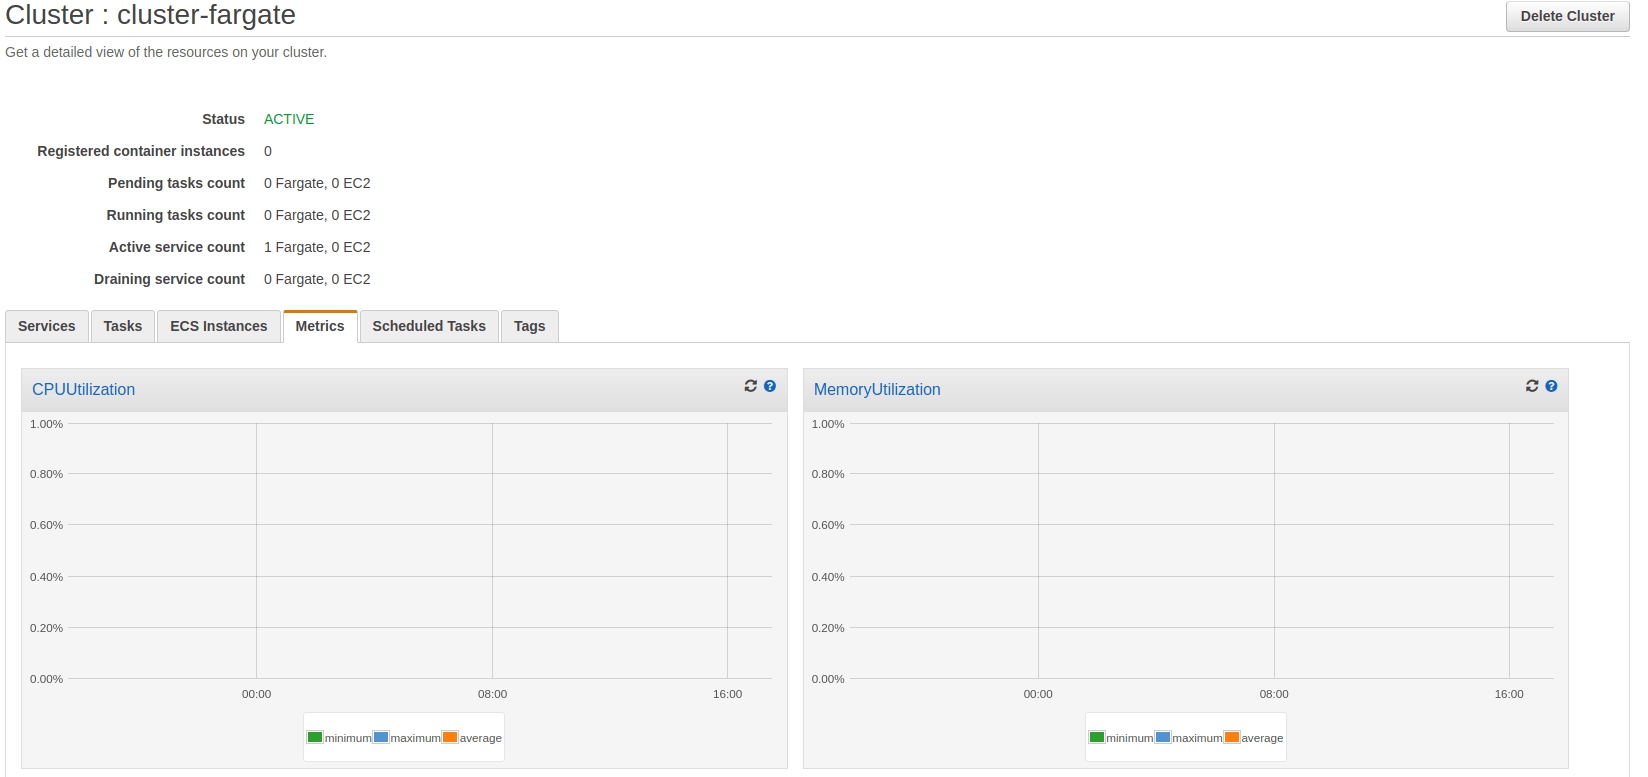
CloudWatch metrics for ECS can be viewed normally through the Metrics portion of CloudWatch, but it is also possible to use the Metrics tab in the cluster console. This tab shows several metric graphs for each cluster.
How to Create CloudWatch Alarms for ECS
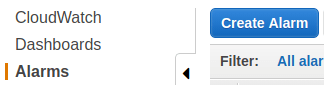
Now that we’ve determined which metrics to monitor, let’s talk about how to create CloudWatch alarms on those metrics. CloudWatch alarms are created from the CloudWatch console.
- Click on Create Alarm.
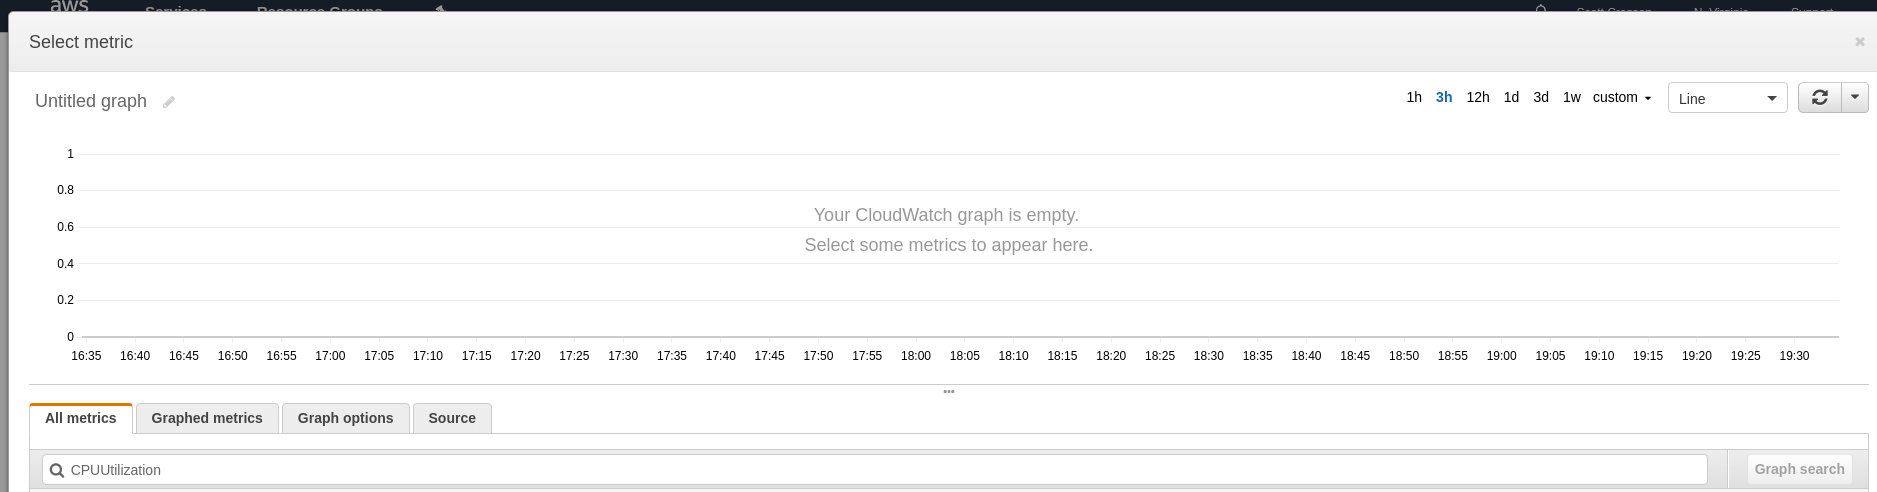
- Click on Select Metric and type the name of the metric into the search box.
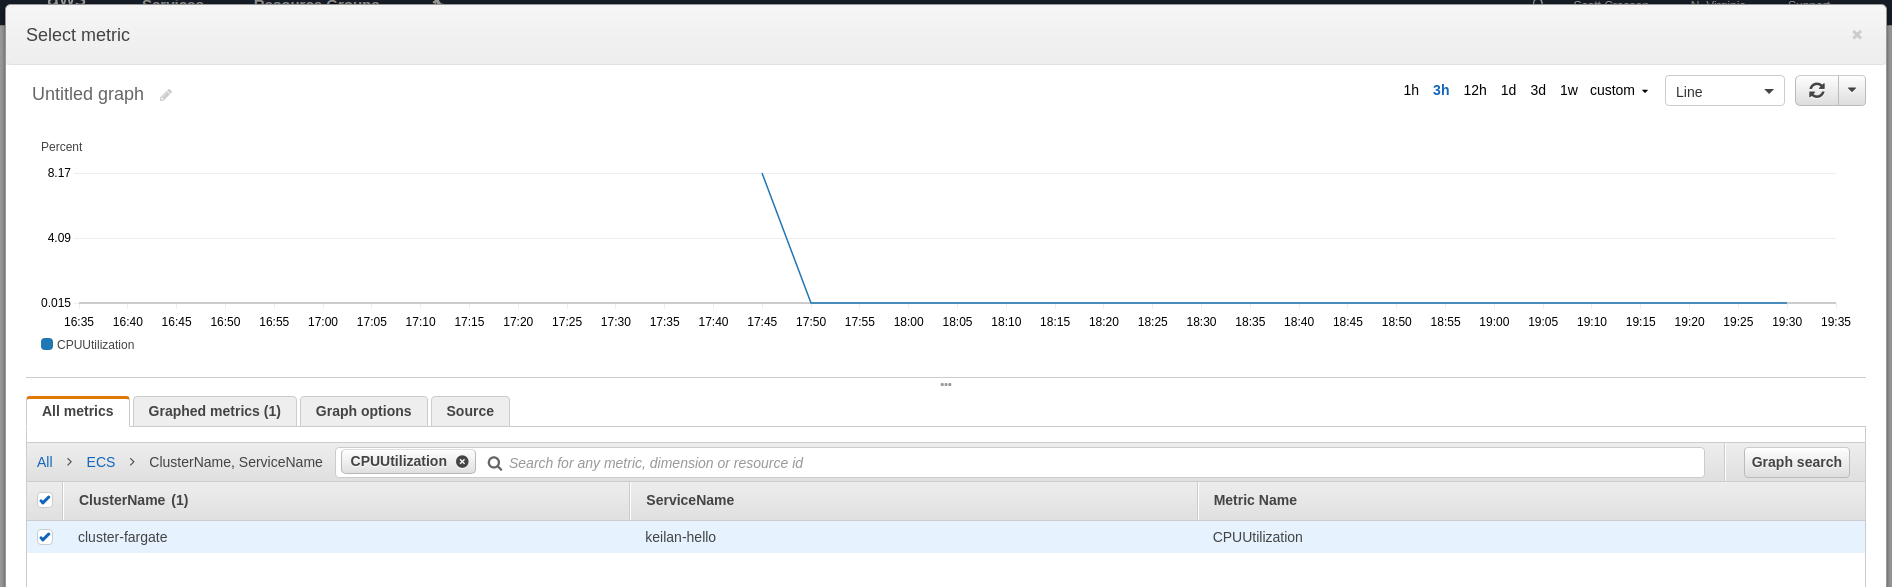
- Choose the metric for the service you’re going to monitor (under ECS > ClusterName, ServiceName). Click Select Metric.
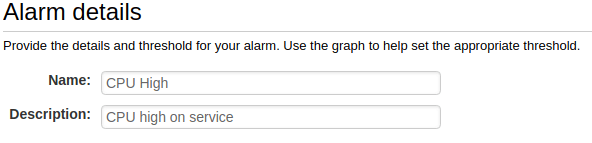
- Name and describe your alarm.
- Configure your thresholds. You can use the thresholds described earlier in this article for each metric.
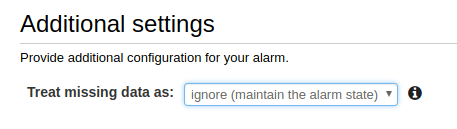
- Choose what to do when data is missing (we recommend ignoring missing data and just keeping the previous state to keep alerts from flapping).
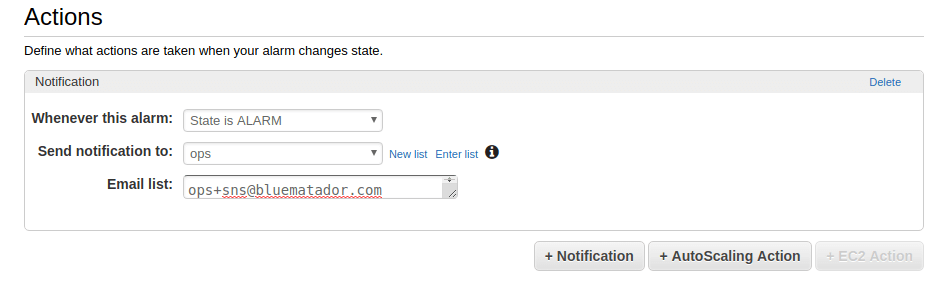
- Set up notifications for the alarm.
- Click Create Alarm.
Unfortunately, since CloudWatch only supports creating an alarm on a single metric, you’ll have to repeat the whole process for each service and metric combination. This can get incredibly time consuming and tedious.
Next Steps
Now you know how to monitor Amazon ECS using CloudWatch. However, it can be error prone and tedious to set up CloudWatch monitoring for all your clusters (and remembering to do it for clusters you create in the future is tough!).
Instead, take the manual work out of monitoring your clusters and use Blue Matador’s automatic setup to effortlessly watch for anomalies and errors within Amazon ECS without any configuration. Blue Matador also monitors things like task health, connectivity, and failure, as well as checks that services have the desired number of tasks. Get started on automatic alerting with Blue Matador now!


