![]()
AWS Beanstalk allows you to spin up entire environments (EC2 instances, ELBs, etc.) to support an application without you having to configure the resources manually. However, since it’s a managed service, you have less visibility with traditional monitoring tools. As such, it becomes even more important to take advantage of the available monitoring tools in AWS. In this post, we’ll explain how to use CloudWatch to monitor Beanstalk and what is important to watch.
Enabling Enhanced Monitoring for Beanstalk
By default, Beanstalk only publishes the EnvironmentHealth metrics to CloudWatch. To get any of the other metrics that are essential for monitoring Beanstalk, you will have to enable enhanced monitoring. AWS has detailed documentation on how to enable enhanced monitoring using the Beanstalk console, CLI, or configuration files. You’ll have to select which metrics you want to be collected by instance or environment, Choose EnvironmentHealth, ApplicationRequestsTotal, ApplicationRequests5xx, ApplicationRequests4xx, and ApplicationLatencyP99 for environments. Select LoadAverage1min and RootFilesystemUtil for instances.
Which Metrics to Monitor
Once you’ve enabled enhanced monitoring, Beanstalk publishes a host of metrics to CloudWatch and looking for abnormalities and limits in these metrics is a great way to spot issues in your environments. However, some metrics are better indicators of environment health than others. In this section, we’ll discuss the metrics to monitor. But first, monitoring some of these metrics requires looking for anomalies specific to your environments, so we’ll explain how to do so in CloudWatch.
Approximating Anomaly Detection in CloudWatch
Because CloudWatch doesn’t support anomaly detection, you’ll have to use averages to find issues. To do so, you’ll want to look at a week of data for a metric and then determine the average high and low. Create a 10% window above the average high and below the average low and you have a good threshold for what looks healthy for your application. However, it should be noted that this method will not account for any time based variation (such as reduced traffic on weekends).
EnvironmentHealth
The most basic Beanstalk metric is EnvironmentHealth, which is an enumeration containing the 7 Beanstalk health statuses as follows:
- 0 – OK
- 1 – Info
- 5 – Unknown
- 10 – No data
- 15 – Warning
- 20 – Degraded
- 25 – Severe
You should alert on anything Degraded or above (though you may also monitor for Warning if your application has stricter requirements) by creating a CloudWatch alarm when the Max statistic is greater or equal to the selected value. For further information about environment health and colors, check out our blog post.
ApplicationRequestsTotal, ApplicationRequests5xx, and ApplicationRequests4xx
Beanstalk measures metrics about the number of requests your application is receiving, as well as the status codes of the responses. Monitoring the total number of requests can help you pinpoint surges in traffic, while monitoring 5xx and 4xx responses is good error detection. To monitor the number of requests, create CloudWatch alarms on ApplicationRequestsTotal, ApplicationRequests5xx, and ApplicationRequests4xx using the anomaly detection method on the Sum statistic for each metric. Bear in mind that this metric is measured for both environments and instances, and we want to monitor the environment version.
ApplicationLatencyP99
ApplicationLatencyP99 measures 99th percentile for application latency, and can be useful to detect when your application’s performance is suffering. When latency increases, it often means that other issues are imminent. To monitor ApplicationLatencyP99, create a CloudWatch alarm on the Average statistic using the anomaly detection method. Bear in mind that this metric is measured for both environments and instances, and we want to monitor the environment version.
Instance Metrics
While monitoring instance metrics can yield some very helpful alerts, if you have any sort of autoscaling or instance rotation in your environment, creating alarms will be ineffective. Any instance you create an alarm on will eventually be removed and replaced -- but your alarm won’t! To mitigate this, you should create an alert on a Math Expression that uses the following search expression:
SEARCH('{AWS/ElasticBeanstalk,EnvironmentName,InstanceId} MetricName="LoadAverage1min"', 'Average', 300)Just replace the metric name and aggregation mentioned in each section.
LoadAverage1min
Load average can help you determine if an instance is overwhelmed. A good rule of thumb is to take this value and calculate the normalized load average from it by dividing the load average by the number of CPU cores the instance has (and remember to change this if your instance type changes!). If that value is greater than 1, consider scaling your application or distributing some of the load to other instances. If the value is greater than 2, then that instance is likely to have performance issues during peak traffic. Create CloudWatch alarms on this metric using the Average statistic.
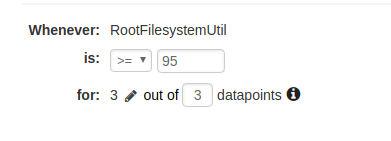
RootFilesystemUtil
If the root filesystem runs out of space then the Enhanced Health monitoring agent may fail. To prevent this, you can clean up large files that are no longer in use, add EBS volumes, or modify your launch configuration to have a larger RootVolumeSize. The most useful statistics will be Average and Maximum. When creating CloudWatch alarms on this metric, set a threshold of about 90-95% disk space utilized, depending on the size of your root volume.
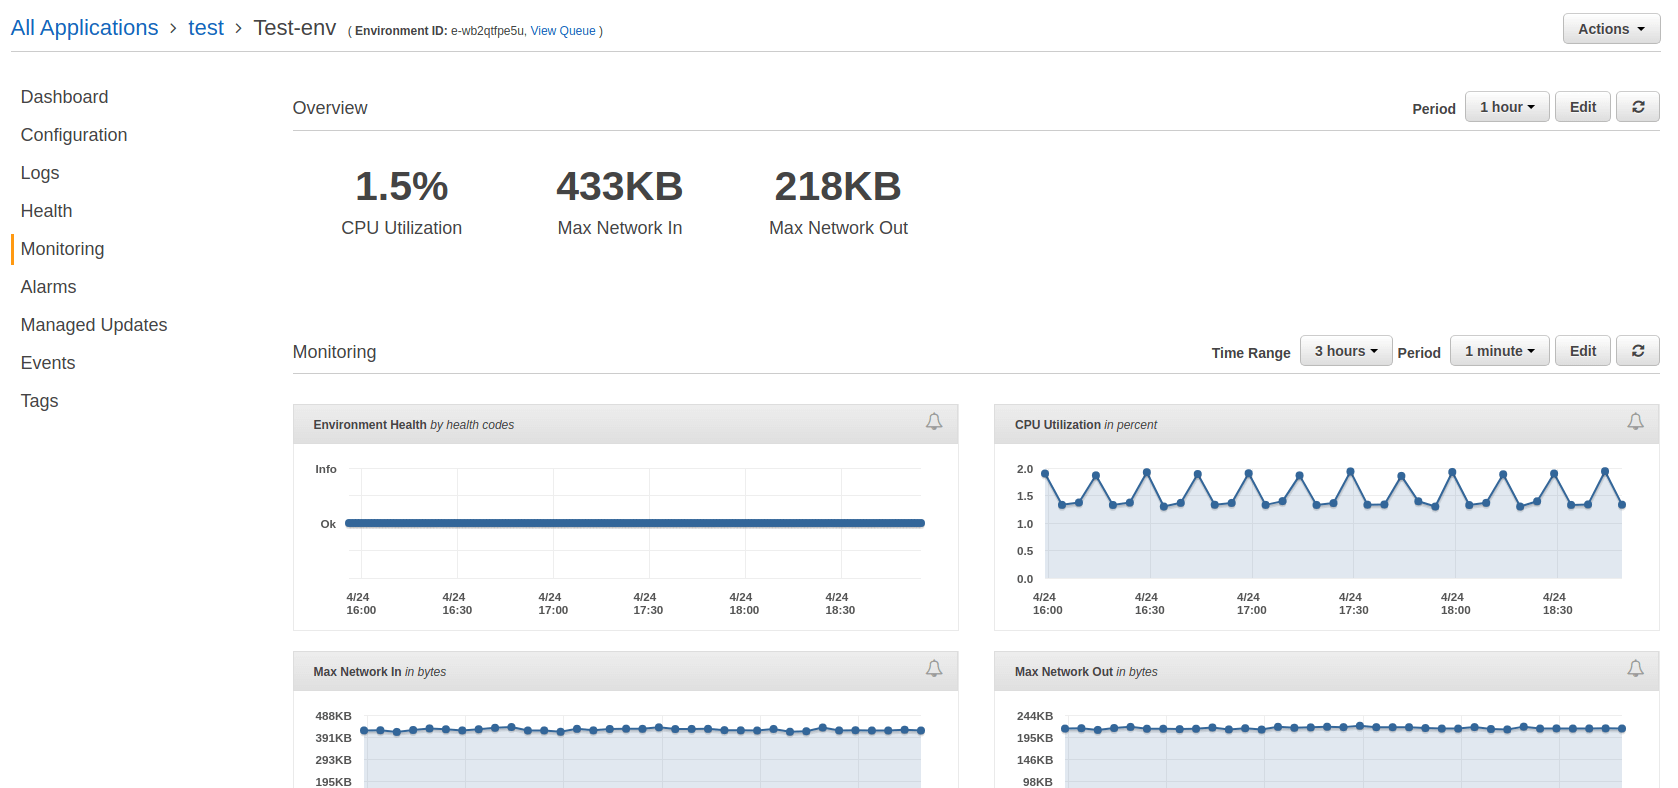
How to View CloudWatch Metrics for Beanstalk
CloudWatch metrics for Beanstalk can be viewed normally through the Metrics portion of CloudWatch, but it is also possible to use the Monitoring tab in the Beanstalk console. This tab shows several metric graphs for the environment.
How to Create CloudWatch Alarms for Beanstalk
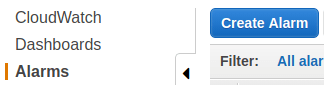
Now that we’ve determined which metrics to monitor, let’s talk about how to create CloudWatch alarms on those metrics. CloudWatch alarms are created from the CloudWatch console.
- Click on Create Alarm.
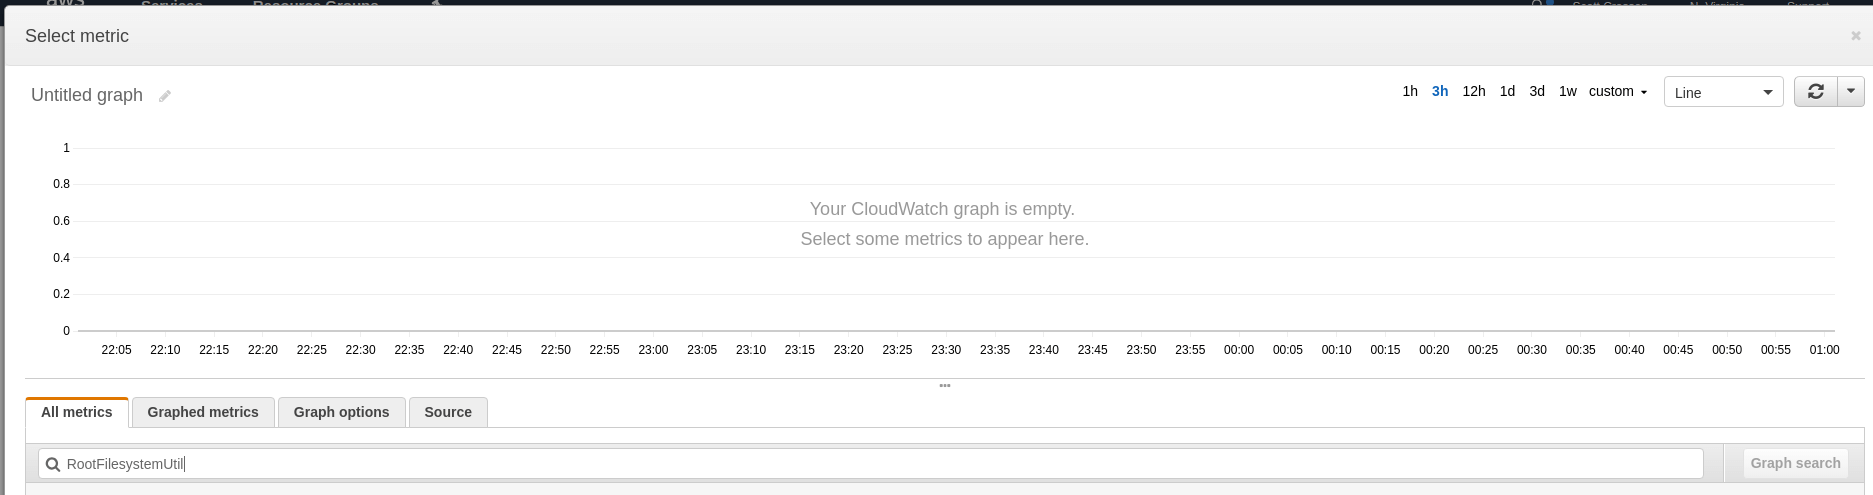
- Click on Select Metric and type the name of the metric into the search box.
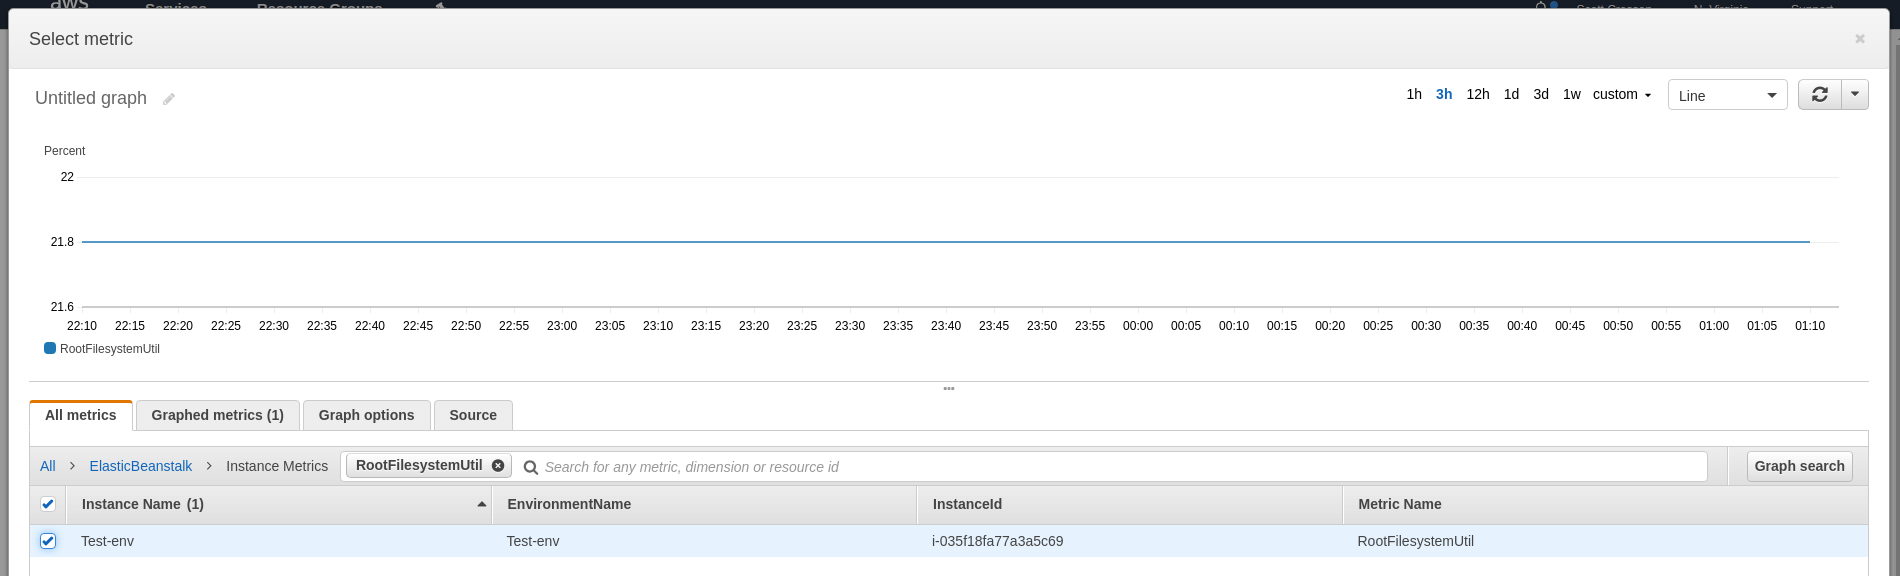
- Choose the metric for the resource you’re going to monitor and look at a 1 week graph to determine what your baselines are. Click Select Metric.
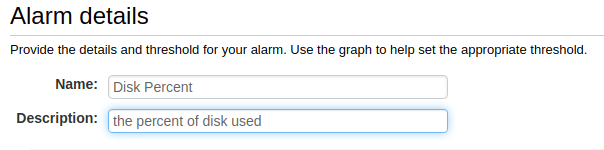
- Name and describe your alarm.
- Configure your thresholds. You can use the thresholds described earlier in this article for each metric.
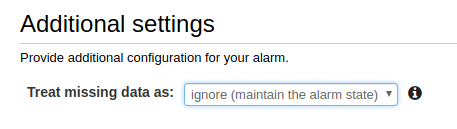
- Choose what to do when data is missing (we recommend ignoring missing data and just keeping the previous state to keep alerts from flapping).
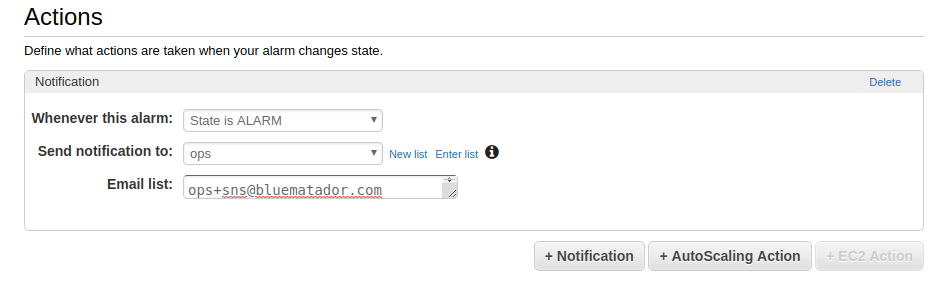
- Set up notifications for the alarm.
- Click Create Alarm.
Unfortunately, since CloudWatch only supports creating an alarm on a single metric, you’ll have to repeat the whole process for each environment/instance and metric combination. This can get incredibly time consuming and tedious.
Next Steps
Now you know how to monitor AWS Elastic Beanstalk using CloudWatch. However, it can be error prone and tedious to set up CloudWatch monitoring for all your environments and instances (and remembering to do it for resources you create in the future is tough!). Even after you get your alarms set up, the instances in your environment will be rotated out through autoscaling and you will lose the monitoring you set up on them.
Instead, take the manual work out of monitoring Beanstalk and use Blue Matador’s automatic setup to effortlessly watch for anomalies and errors within AWS Elastic Beanstalk without any configuration. This is especially important in a system like Beanstalk, where monitoring depends heavily on anomaly detection. Get started on automatic alerting with Blue Matador now!