
Solving a dying Golang process with Keilan Jackson at Blue Matador
I started the new GuardianDevOps service to share my expertise with other engineers. I was thrilled to find an internal problem to work on as the inaugural session! Only a single day after I decided to start this service, a Blue Matador customer noticed some repetitive alerts from our agent heartbeat. I was excited to join the fray with Keilan, one of our talented engineers, and fix the problem for our customers.
First, a little about Keilan.
 Tabs vs Spaces: Spaces
Favorite IDE: Atom
Current OS: Pop! OS
iPhone vs Android: Has an Android, prefers an iPhone
Favorite Superhero: Thor. He’s literally a god, and the only one who can kill Thanos.
Twitter Handle: krjacks0
Celebrity Doppelganger: Mark Nowak (powered by www.celebslike.me)
I’m also excited to show that bugs are a given. It’s not embarrassing to have them, so long as you can learn from them. The focus of this article, and all subsequent articles is the learning that took place in troubleshooting. The solution we implemented was to disable cgo. That may or may not work for you, but what we learned is far more valuable. Check the bottom for what we learned together.
Symptoms
It all started with a customer of Blue Matador reporting a set of flapping alerts around our agent heartbeat. The agent is a process hierarchy written in Golang that maintains an open connection to Blue Matador’s servers in AWS. Whenever that connection is severed (restarts, dead server, network outage, etc.), Blue Matador sends an alert. That alert is automatically resolved when the server re-connects to Blue Matador. The support request said:
“are these false positives? Getting notices about unresponsive servers but things look fine on the boxes.”
We track metrics for every alert, warning, and anomaly we send. While it’s pretty normal to see spikes in the graph, it’s pretty obvious that our problem started on Feb 20.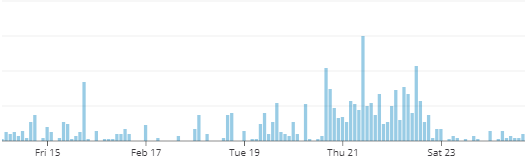
Number of alerts sent from Blue Matador
The flapping alert is auto-generated from the missed heartbeat or the severed connection.

Example alert about severed connection
The customer worked with us to enable verbose logging and get the agent logs from the affected servers. They all followed this general pattern, repeated over and over again.
=> config [DEBUG]: 2019/02/21 21:51:15 module.go:223: Attempting to start process after the sleep... bluematador-collector
=> config [DEBUG]: 2019/02/21 21:51:15 module.go:316: Starting module bluematador-collector /var/lib/bluematador-agent/modules/bluematador-collector/3.1.25.dc1450b41e2b740b4f2fd8ca01ae6dc427b0cd29/bluematador-collector [-log /var/log/bluematador-agent.log -verbose 6 -datadir /var/lib/bluematador-agent -config /etc/bluematador-agent/config.ini]
=> collector [INFO]: 2019/02/21 21:51:15 app.go:32: Module Magnesium started in normal mode
=> collector [INFO]: 2019/02/21 21:51:15 broker.go:111: Registered metric cpu_system
=> collector [INFO]: 2019/02/21 21:51:15 broker.go:111: Registered metric cpu_iowait
=> collector [INFO]: 2019/02/21 21:51:15 broker.go:111: Registered metric cpu_steal
=> collector [INFO]: 2019/02/21 21:51:15 broker.go:111: Registered metric disk_reads_sec
=> collector [INFO]: 2019/02/21 21:51:15 broker.go:111: Registered metric disk_writes_sec
=> collector [INFO]: 2019/02/21 21:51:15 broker.go:111: Registered metric disk_latency
=> collector [INFO]: 2019/02/21 21:51:15 broker_unix.go:167: Registered metric dns
=> collector [INFO]: 2019/02/21 21:51:15 broker.go:111: Registered metric fs_disk_util
=> collector [INFO]: 2019/02/21 21:51:15 broker.go:111: Registered metric fs_inodes_util
=> collector [INFO]: 2019/02/21 21:51:15 broker_unix.go:91: Registered metric kubernetes
=> collector [INFO]: 2019/02/21 21:51:15 broker.go:111: Registered metric load_1_norm
=> collector [INFO]: 2019/02/21 21:51:15 broker.go:111: Registered metric mem_swap_in
=> collector [INFO]: 2019/02/21 21:51:15 broker.go:111: Registered metric net_rcvd_packet
=> collector [INFO]: 2019/02/21 21:51:15 broker.go:111: Registered metric net_sent_packet
=> collector [INFO]: 2019/02/21 21:51:15 broker.go:111: Registered metric net_rcvd_byte
=> collector [INFO]: 2019/02/21 21:51:15 broker.go:111: Registered metric net_sent_byte
=> collector [INFO]: 2019/02/21 21:51:15 broker.go:111: Registered metric net_total_error
=> collector [INFO]: 2019/02/21 21:51:15 broker.go:111: Registered metric net_total_drops
=> collector [INFO]: 2019/02/21 21:51:15 broker_unix.go:53: Registered metric processes
=> collector [INFO]: 2019/02/21 21:51:15 broker.go:111: Registered metric proc_open_files
=> collector [INFO]: 2019/02/21 21:51:15 broker.go:111: Registered metric proc_threads
=> collector [INFO]: 2019/02/21 21:51:15 broker.go:111: Registered metric time_drift
=> collector [TRACE]: 2019/02/21 21:51:15 app.go:85: Starting application
=> collector [TRACE]: 2019/02/21 21:51:15 client.go:156: Starting wsclient
=> collector [TRACE]: 2019/02/21 21:51:15 broker.go:390: Starting Broker
=> collector [TRACE]: 2019/02/21 21:51:15 persist.go:154: Starting Trigger Persistence
=> collector [TRACE]: 2019/02/21 21:51:15 tick.go:79: Starting CPU Collector
=> collector [TRACE]: 2019/02/21 21:51:15 tick.go:79: Starting DISK Collector
=> collector [TRACE]: 2019/02/21 21:51:15 tick.go:79: Starting DNS Collector
=> collector [TRACE]: 2019/02/21 21:51:15 tick.go:79: Starting FS Collector
=> collector [TRACE]: 2019/02/21 21:51:15 tick.go:79: Starting K8S Collector
=> collector [TRACE]: 2019/02/21 21:51:15 tick.go:79: Starting LOAD Collector
=> collector [TRACE]: 2019/02/21 21:51:15 tick.go:79: Starting MEM Collector
=> collector [TRACE]: 2019/02/21 21:51:15 tick.go:79: Starting NET Collector
=> collector [TRACE]: 2019/02/21 21:51:15 tick.go:79: Starting PROC Collector
=> collector [TRACE]: 2019/02/21 21:51:15 tick.go:79: Starting TIME DRIFT Collector
=> collector [TRACE]: 2019/02/21 21:51:15 app.go:116: Waiting application
=> config [DEBUG]: 2019/02/21 21:51:15 reader.go:37: Reader got EOF bluematador-collector-module EOF
=> config [DEBUG]: 2019/02/21 21:51:15 module.go:231: Unexpected close of read channel in module bluematador-collector
=> config [DEBUG]: 2019/02/21 21:51:15 module.go:248: Unexpected read channel close caused by dead process bluematador-collector Restarting process after 24.931123875s
=> config [DEBUG]: 2019/02/21 21:51:15 module.go:367: bluematador-collector shut down normally
=> config [DEBUG]: 2019/02/21 21:51:40 module.go:223: Attempting to start process after the sleep... bluematador-collector
The customer confirmed that the server was having no problems except for our agent restarting over and over again. The CPU, memory, disk, other processes, AWS host, EBS stats, and everything else looked normal.
As we looked for other accounts and servers affected by whatever bug this was, we found a rather odd pattern. All of this customer’s servers in AWS zone us-east-1a were affected by this bug, and all of their other servers in all other zones were fine. We also discovered another customer who was having this same issue, and it was a similar AWS zone split — all the servers in one zone were affected, and all the other servers were fine.
Only these two customers were affected, despite sharing the availability zone, region, Linux kernel, Ubuntu distribution, and even application runtimes with other customers. The uname command in linux returned the following:
Linux ip-172-31-49-211 4.4.0-1070-aws #80-Ubuntu SMP Thu Oct 4 13:56:07 UTC 2018 x86_64 x86_64 x86_64 GNU/LinuxService restarts didn’t work, package re-installs didn’t work. We tried the usual suspects over a very short amount of time, but still they continued to get the alerts about server unresponsive. One of the customer’s Blue Matador timeline was riddled with these alerts.

Blue Matador timeline showing just server unresponsive alerts
As for the symptoms’ effect on customers, only one of the customers even noticed it (the one we worked with), and he was incredibly helpful. We really do have the best customers :)
Context
To understand the problem and solution, you’ll need to understand more about the Blue Matador agent’s build and runtime environments, Inter-Process Communication (IPC), error handling, and logging.
Build and Runtime Environments
The agent is written entirely in Golang, compiled with cgo for amd64 Windows and Linux machines. There are multiple modules in the agent. Each module is compiled using the same options, but with different libraries. Libraries are managed using the glide package manager. A makefile and a docker container provide a clean environment for building during every release.
There is a parent module and a child module. The parent module makes sure the child module is running, up-to-date, and reporting. It also does check-ins, which download new settings, authentication tokens, and module information. The child module is responsible for maintaining the active connection to Blue Matador’s servers, collecting data from the local system, aggregating the data, and sending relevant updates upstream. The child is what’s aware of ulimits, running processes, ports, cpu, memory, swap, and all the other metrics we keep tabs on.
Inter-Process Communication (IPC)
IPC works both on Windows and Linux to communicate between the parent and child modules. stdin and stdout on the child are connected to a pipe in the parent, while stderr is the same between them. The parent sends heartbeats to the child on these pipes, and if the child ever fails to respond, the parent kills and restarts the child.
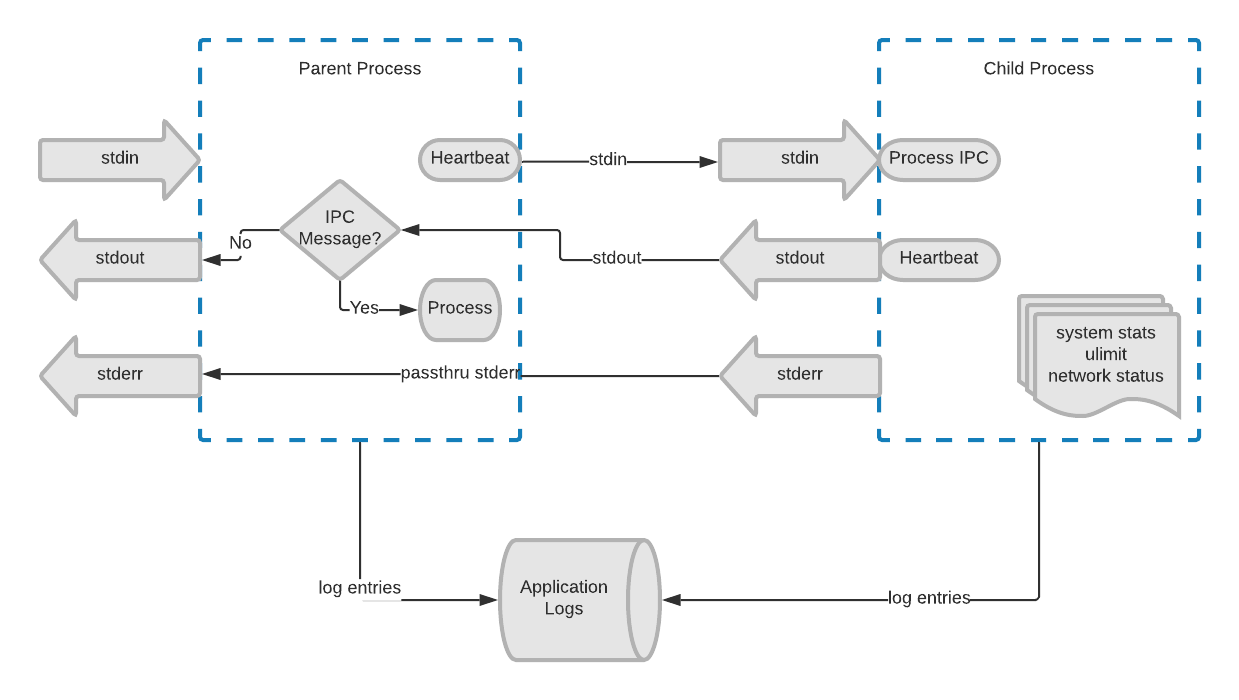 IPC and logging between parent and child processes
When the parent intends to shut down the child, whether for an update, system restart, or other, the parent closes the stdin pipe of the child. That signifies to the child that it’s time to clean up resources, stop watching metrics, make one final report, and shut down gracefully. At that time, the parent can do whatever it needs to do.
Error Handling
Both modules utilize goroutines and heavy use of the synchronization libraries to run checks, downloads, and discovery in parallel. By default, if any goroutine panics, the whole process dies, but we put special handling around every goroutine to log the error and retry or gracefully fail, so that the process never dies.
In golang, there are two different methods of error handling. The first is expected errors. Every function can return multiple values, and it’s standard practice to return an error as the last value if an error is possible. Unlike exceptions, these errors never alter program control. The second is panics, which get thrown like exceptions, and must be caught using a combination of the defer keyword and the recover() function. Since any goroutine that panics can crash the whole program, we wrap every goroutine in a call to LogPanics or IgnorePanics as defined below.
package safefunc

import (
	"common/log"
)

func LogPanics(name string, callback func()) {
	defer func() {
		if err := recover(); err != nil && name != "" {
			log.Warn.Println("Panic in", name, err)
		}
	}()

	callback()
}

func IgnorePanics(callback func()) {
	LogPanics("", callback)
}
Logging
We wrote our own logging wrapper in the agent. It takes log severity into account, and then either logs the entry to file or discards it. The logs pasted earlier in the post are with all logging but trace level. We also have the capability to send data to stdout and stderr, but never use it. The parent and child modules have a special code for communicating between each other, and if that code isn’t used, the parent assumes it was meant to be printed, and sends it to stdout (as opposed to processing it as a heartbeat or other IPC message). stderr is always duplicated (as previously mentioned), so there’s no intercept of messages.
Theories
Theory #1: The parent module is actively killing the child. The parent sends frequent heartbeats to the child over the shared pipe. Normally, the child responds immediately with a response heartbeat. If the child ever fails to respond within about 30 seconds, the parent kills the child process and restarts it. When the parent kills the child, a log entry is generated containing the message “unresponsive. Forcefully killing”. With tens of thousands of tries in the log file, not one of these entries appeared even a single time. The parent never forcefully killed the child process. All of the log entries had the message below, which indicates the child died without the help or intervention of the parent.
=> config [DEBUG]: 2019/02/21 21:51:15 module.go:231: Unexpected close of read channel in module bluematador-collector
Theory #2: An antivirus or watchdog process on the customer’s server was actively killing the child process. Our agent regularly communicates with the public internet, downloads binaries, and executes additional processes. If an antivirus program identified our process as a threat, and it was written to stop execution (instead of preventing execution), then it could actively kill our process in the 250ms-5s range that it took for our process to die. The customer confirmed that no such software existed on his servers. Even if he did, it was unlikely that he would only put it on a subset of his servers in one AZ. It’s even less likely that two customers would have that same process running.
Theory #3: The OS is killing the child via kernel panic or OOM. We tried to reproduce this using the same AMI, same region, same instance type, and same programs installed. It would not reproduce, and there was no evidence of lack of memory.
Theory #4: Pipes, stdin, and stdout are coded wrong. This theory relies on common knowledge that forking pipes are not simple to read in code. The parent logs a message about “Reader got EOF bluematador-collector-module EOF.” This could happen if the parent closes the pipes before forking, or closes the wrong pipe after forking. We verified all aspects of the code, including the mutex for forking, order of forking/closing, and cleaning up resources post-fork. We also checked the child for heartbeat responses. It’s also possible that the child closes the stdout pipe prematurely, and the parent receives the EOF. We would have seen a “Closing pipe” log entry if that were the case, and it was nowhere in the log. Also, we noted that the child process wasn’t even staying up for long enough to get the heartbeat from the parent, much less fail to respond to one with a timeout of 30 seconds. The longest child module, in the entire log file, lasted only 5 seconds. This makes sense, since even if the child failed to send a heartbeat, the parent would still have to kill it, which would require an entry in the log file that we already failed to find.
Theory #5: One of the Golang libraries calls exit() when it shouldn’t. We knew that the child process was dying, and that the parent wasn’t killing it, perhaps the child was calling exit() somewhere in a dependent library. A quick search revealed hundreds of possible targets. After excluding tests and files with main() in them, the search was reduced to zero targets. And the chances that the framework developers at Google put an exit() call in the framework is grasping at straws, too.
Theory #6: The pipe is being closed accidentally by another process or by the kernel. This doesn’t happen. Ever. Dumb idea.
Problem
The real problem was a segfault in the child module. On segfault, the child process dies, without any further log files, and the stdin and stdout pipes are closed. The parent recognizes these closed pipes, logs the messages it does, and restarts the process.
A secondary problem was in our logging. Our expectation was that all logs went to our application log file. During bootstrap, we create a logging struct with severity and location. Despite the bootstrapping, the segfault wasn’t found in our application logs. Segfaults are delivered via Linux signals. If unhandled, segfault causes the program to die with a message on stderr. As a daemon process, our stderr was sent to syslog. Getting the syslog from the customer revealed the segfault, the 344 line stacktrace, and the root cause. Here’s an excerpt:
Feb 22 06:25:20 ip-172-31-27-166 bluematador-agent[9492]: fatal error: unexpected signal during runtime execution
Feb 22 06:25:20 ip-172-31-27-166 bluematador-agent[9492]: [signal SIGSEGV: segmentation violation code=0x1 addr=0x63 pc=0x7fa58d172448]
Feb 22 06:25:20 ip-172-31-27-166 bluematador-agent[9492]: runtime stack:
Feb 22 06:25:20 ip-172-31-27-166 bluematador-agent[9492]: runtime.throw(0x130977b, 0x2a)
Feb 22 06:25:20 ip-172-31-27-166 bluematador-agent[9492]: #011/usr/local/go/src/runtime/panic.go:619 +0x81
Feb 22 06:25:20 ip-172-31-27-166 bluematador-agent[9492]: runtime.sigpanic()
Feb 22 06:25:20 ip-172-31-27-166 bluematador-agent[9492]: #011/usr/local/go/src/runtime/signal_unix.go:372 +0x28e
Feb 22 06:25:20 ip-172-31-27-166 bluematador-agent[9492]: goroutine 7 [syscall]:
Feb 22 06:25:20 ip-172-31-27-166 bluematador-agent[9492]: runtime.cgocall(0xfb83b0, 0xc42005cdf8, 0x29)
Feb 22 06:25:20 ip-172-31-27-166 bluematador-agent[9492]: #011/usr/local/go/src/runtime/cgocall.go:128 +0x64 fp=0xc42005cdb8 sp=0xc42005cd80 pc=0x4023b4
Feb 22 06:25:20 ip-172-31-27-166 bluematador-agent[9492]: net._C2func_getaddrinfo(0xc4211ec200, 0x0, 0xc421b2e3c0, 0xc42000e040, 0x0, 0x0, 0x0)
Feb 22 06:25:20 ip-172-31-27-166 bluematador-agent[9492]: #011_cgo_gotypes.go:86 +0x55 fp=0xc42005cdf8 sp=0xc42005cdb8 pc=0x51cae5
Feb 22 06:25:20 ip-172-31-27-166 bluematador-agent[9492]: net.cgoLookupIPCNAME.func1(0xc4211ec200, 0x0, 0xc421b2e3c0, 0xc42000e040, 0x14, 0x14, 0xc4200b8800)
Feb 22 06:25:20 ip-172-31-27-166 bluematador-agent[9492]: #011/usr/local/go/src/net/cgo_unix.go:149 +0x13b fp=0xc42005ce40 sp=0xc42005cdf8 pc=0x52378b
Feb 22 06:25:20 ip-172-31-27-166 bluematador-agent[9492]: net.cgoLookupIPCNAME(0xc4211ec120, 0x13, 0x0, 0x0, 0x0, 0x0, 0x0, 0x0, 0x0)
Feb 22 06:25:20 ip-172-31-27-166 bluematador-agent[9492]: #011/usr/local/go/src/net/cgo_unix.go:149 +0x174 fp=0xc42005cf38 sp=0xc42005ce40 pc=0x51e154
Feb 22 06:25:20 ip-172-31-27-166 bluematador-agent[9492]: net.cgoIPLookup(0xc421b321e0, 0xc4211ec120, 0x13)
Feb 22 06:25:20 ip-172-31-27-166 bluematador-agent[9492]: #011/usr/local/go/src/net/cgo_unix.go:201 +0x4d fp=0xc42005cfc8 sp=0xc42005cf38 pc=0x51e81d
Feb 22 06:25:20 ip-172-31-27-166 bluematador-agent[9492]: runtime.goexit()
Feb 22 06:25:20 ip-172-31-27-166 bluematador-agent[9492]: #011/usr/local/go/src/runtime/asm_amd64.s:2361 +0x1 fp=0xc42005cfd0 sp=0xc42005cfc8 pc=0x457bd1
Feb 22 06:25:20 ip-172-31-27-166 bluematador-agent[9492]: created by net.cgoLookupIP
Feb 22 06:25:20 ip-172-31-27-166 bluematador-agent[9492]: #011/usr/local/go/src/net/cgo_unix.go:211 +0xaf
Feb 22 06:25:20 ip-172-31-27-166 bluematador-agent[9492]: goroutine 1 [chan receive]:
Feb 22 06:25:20 ip-172-31-27-166 bluematador-agent[9492]: main.(*MagnesiumApp).Wait(0xc421a4c820)
Feb 22 06:25:20 ip-172-31-27-166 bluematador-agent[9492]: #011/app/quartz/src/magnesium/app.go:118 +0xa7
Feb 22 06:25:20 ip-172-31-27-166 bluematador-agent[9492]: common/bootstrap.BootstrapModule(0x12de900, 0x9, 0xc4211bf7a0, 0x2f, 0x1365748)
Feb 22 06:25:20 ip-172-31-27-166 bluematador-agent[9492]: #011/app/quartz/src/common/bootstrap/module.go:140 +0x365
Feb 22 06:25:20 ip-172-31-27-166 bluematador-agent[9492]: main.main()
Feb 22 06:25:20 ip-172-31-27-166 bluematador-agent[9492]: #011/app/quartz/src/magnesium/magnesium.go:15 +0x5a
Feb 22 06:25:20 ip-172-31-27-166 bluematador-agent[9492]: goroutine 19 [syscall]:
Feb 22 06:25:20 ip-172-31-27-166 bluematador-agent[9492]: os/signal.signal_recv(0x0)
Feb 22 06:25:20 ip-172-31-27-166 bluematador-agent[9492]: #011/usr/local/go/src/runtime/sigqueue.go:139 +0xa6
Feb 22 06:25:20 ip-172-31-27-166 bluematador-agent[9492]: os/signal.loop()
Feb 22 06:25:20 ip-172-31-27-166 bluematador-agent[9492]: #011/usr/local/go/src/os/signal/signal_unix.go:22 +0x22
Feb 22 06:25:20 ip-172-31-27-166 bluematador-agent[9492]: created by os/signal.init.0
… <309 lines omitted> ...
We compile using Cgo to enable a certain networking library. Cgo is a compiler that enables C code to be used in Golang programs. There are side effects to using Cgo, like dynamic linking (versus Go’s default static linking) and using Cgo’s DNS resolver (versus Go’s default DNS resolver). There are more side effects, but these ones are the cause of the problem.
The segfault is caused by a combination of installed libraries on that customer’s specific servers working with our dynamically linked binary to resolve a DNS name. Notice in the stack trace a call to net.cgoLookupIP. We knew dynamic linking could be a problem at the outset of using Cgo, and passed in what we thought were the appropriate compiler options to use static linking, but it obviously failed. The dynamic linking also explains why only some servers had the issue, and why we couldn’t reproduce it. There’s something about their versions of the libraries that are incompatible with our binary. It’s nothing our customers did intentionally, just a perfect storm.
Solution
If you’ve had this exact problem before, the solution is going to disappoint. We solved this problem by removing the networking library and avoiding Cgo altogether. The library wasn’t necessary, and Cgo only caused us problems, so we ripped it out and opted to use the default Go compiler.
There was a snag on the rollout that caught us off-guard. At first, we didn’t realize that the problem was the DNS resolver and dynamic linking. Initially, we thought it was the presence of this networking library. The quick fix we made was to remove the library but leave Cgo in place. It slowed down the segfaults, but didn’t eliminate them. That’s when we realized the actual issue and changed the compiler back to Go.
Here is the diff from the commit that removed Cgo:
-	CC=gcc GOOS=linux GOARCH=amd64 CGO_ENABLED=1 go build -a -installsuffix cgo -o “agent” -ldflags ‘-extldflags “-static”’ magnesium
+	GOOS=linux GOARCH=amd64 CGO_ENABLED=0 go build -a -o “agent” magnesium
I realize this isn’t the solution for most cases — removing the libraries and using the default compiler. That said, it did work for us, and if you can get away with it, I recommend it. If not, you now see why I said that this answer was disappointing.
Learnings
Segfaults still exist in Go. Especially if you use Cgo! Go does a really good job of hiding the complexity of memory management, memory pointers, and segfaults, but it is still a low level programming language and can have segfaults. A quick search of “golang segfault” reveals quite a few people having issues with them in Go.
Go error handling does not handle segfaults. They are not panics, they are not return values. Go doesn’t handle them at all by default. Catching panics with the defer/resolve functions does not handle segfaults.
Segfaults are signals, kill the process, and logs a stack trace to stderr. Catching a SIGSEGV signal is probably a bad idea in most cases. Since you likely don’t handle them, remember that the process dies and the output goes to stdout. If you’re running a daemon like us, check the OS system log for segfault information.
When asking for logs from customers, always get system logs. Even if we hadn’t known about the stderr thing, it would have been immediately obvious where our problem was if we had all the logs initially. There were millions of lines of segfault stack traces in the logs. Always ask for the system logs.
We weren’t statically linking our Cgo binary like we thought we were. After reading the docs for Cgo compilation options, we determined that the -static option was enough to make the binary statically linked, but it wasn’t.
Using Cgo changes the DNS resolver. Knowing this probably wouldn’t have helped us resolve the issue faster, but it’s something we didn’t know before. The Cgo resolver uses the system resolution more. Here’s an interesting article about it: https://engineering.grab.com/dns-resolution-in-go-and-cgo
Credits
![]()
Guardian DevOps is a free service that puts you in contact with DevOps and SRE experts to solve your infrastructure, automation, and monitoring problems. Tag us in a post on Twitter @GuardianDevOps, and together we’ll solve your problems in real time. Sponsored by Blue Matador.
Tweet to @GuardianDevOps Follow @guardiandevops
![]()
Blue Matador is an automated monitoring and alerting platform. Out-of-the-box, Blue Matador identifies your AWS and computing resources, understands your baselines, manages your thresholds and sends you only actionable alerts. No more anxiety wondering, “Do I have an alert for that?” Blue Matador has you covered.


