
What do you expect from a monitoring tool? What should you expect?
The Blue Matador team has spent 2018 making a next-gen monitoring tool. Our design goals came from thrilled customers and lots of interviews. Among the top expectations are these statements:
- I want a tool that manages thresholds for me.
- I want a tool that finds the unknowns automatically.
- I want a tool that lets me focus on core IP, not monitoring.
So that’s what we built. Let me highlight a few features and use cases.
Automated Alerting in Kubernetes
Kubernetes is such a black box that’s supposed to work all the time, but doesn’t. The worst part about their auto-healing philosophy is that when something does break, Kubernetes doesn’t have a mechanism to tell ![]() you it broke; it’s on the sysadmin to figure out that something broke, and then to investigate. For instance, if you use kubectl to launch a container, and the container fails to launch for a variety of reasons, k8s will never tell you. It’s on the sysadmin to notice that the service doesn’t work, inspect the cluster, and fix any problems.
you it broke; it’s on the sysadmin to figure out that something broke, and then to investigate. For instance, if you use kubectl to launch a container, and the container fails to launch for a variety of reasons, k8s will never tell you. It’s on the sysadmin to notice that the service doesn’t work, inspect the cluster, and fix any problems.
Out of the box, Blue Matador finds 15 different types of events in kubernetes, which range from failed component statuses to failed persistent volume mounts and everything in between. Here are three events we see over and over that customers frequently miss.
Containers Restarting. Kubernetes automatically restarts containers, shuffles them around, and handles high availability for you. By doing so, it hides memory leaks, thread leaks, configuration errors, deadlock, etc. While you wouldn’t want to wake up in the middle of the night for this alone, it’s good to know about and address early.
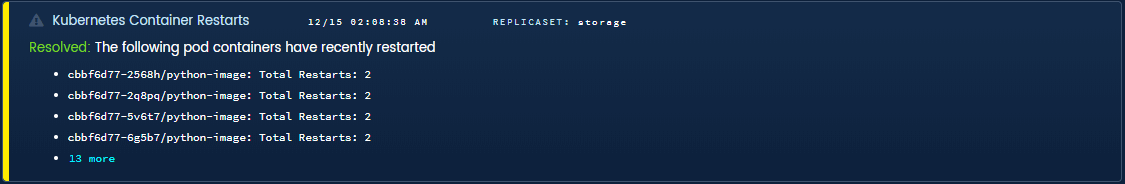
Blue Matador automated warning for frequently restarted containers in k8s
Job Failed. Kubernetes can run backup jobs just like cron, except in a distributed and fault-tolerant way. Too fault-tolerant, actually. If jobs fail, it could have negative side-effects on customer accounts and application code, and yet kubernetes never reports these to sysadmins. Again, it’s up to the sysadmin to notice, investigate, and fix — unless you have Blue Matador.

Blue Matador automated anomaly for job that failed to run
Deployment Unhealthy. Deployments, services, and daemonsets all have their own state of equilibrium. Kubernetes will do its best to maintain that state, but it frequently fails due to node conditions, cluster status, or code issues. The last thing you want is a botched release to go unnoticed and propagate to your users. Staying apprised of deployments, services, and daemonsets can be vital to your application’s future health.

Blue Matador alert for unhealthy kubernetes deployment
Setup is a breeze. 90% of our users complete setup from start to finish in under an hour. It has a couple easy steps:
- Specify your cluster name.
- Specify the desired namespace for the daemonset.
- Set up role-based authentication controls (RBAC) using our template.
- Configure the daemonset using our template.
- Deploy the daemonset across your cluster using kubectl.
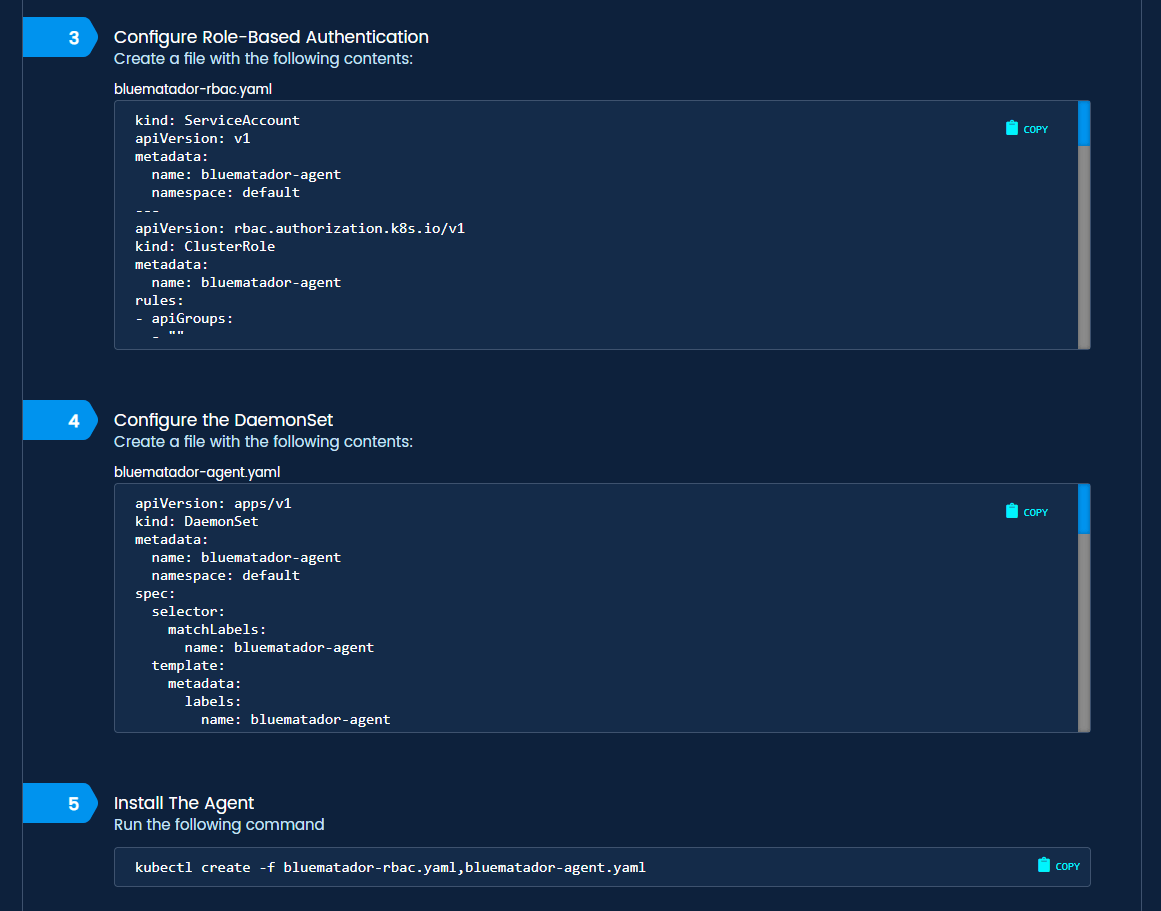
Kubernetes install steps in Blue Matador
Automated Alerting in AWS
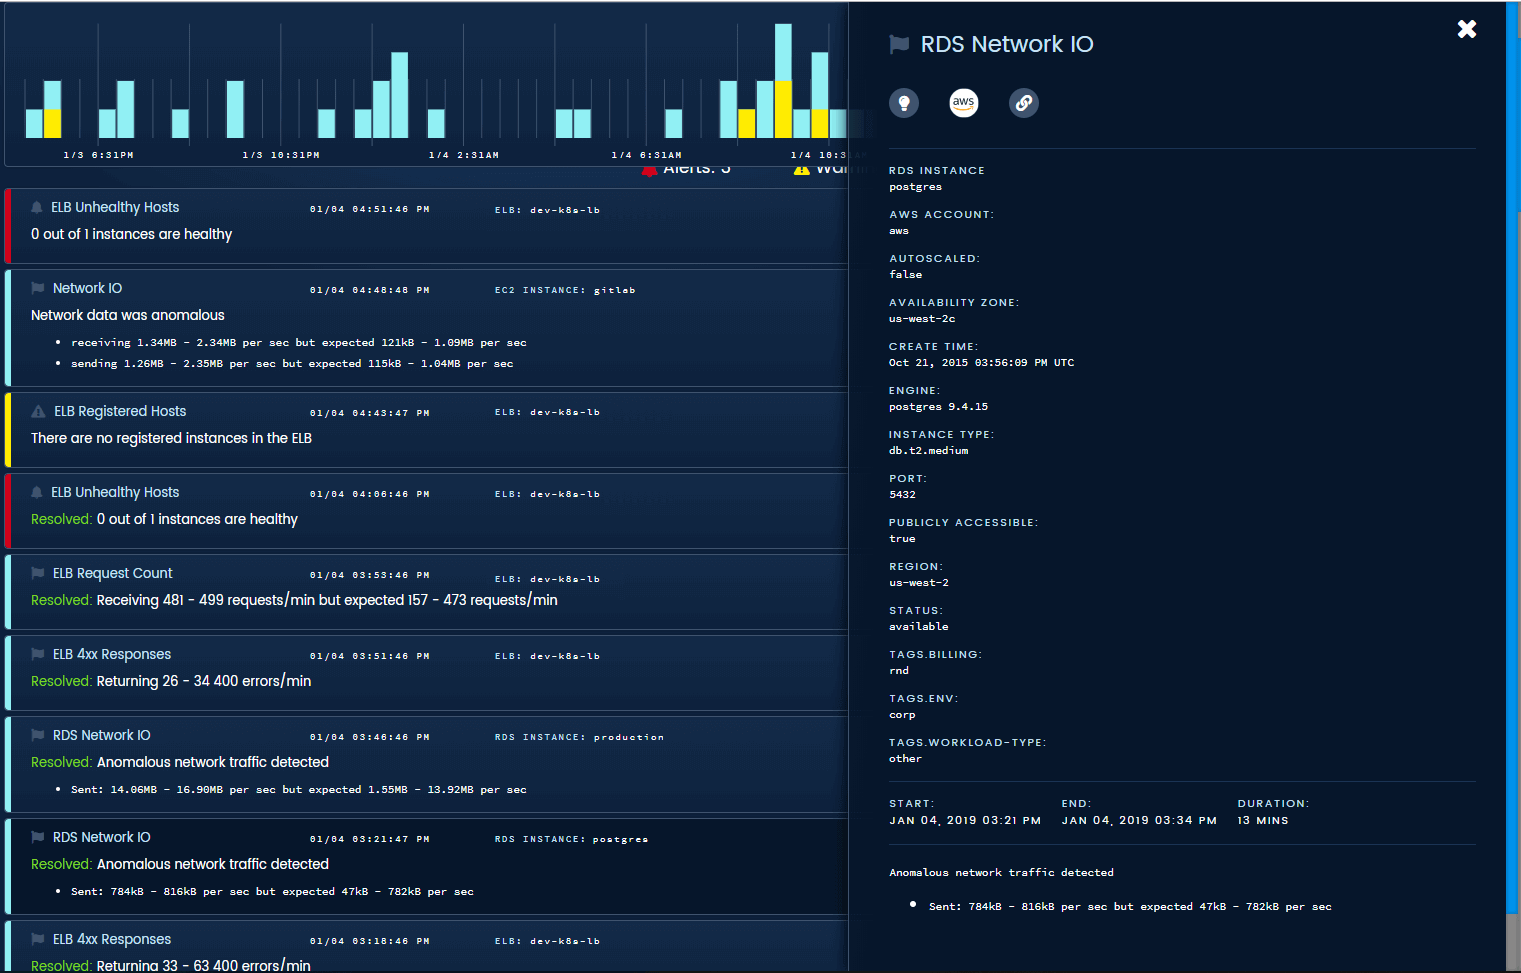
We also support all of the production services from Amazon Web Services like EC2, RDS, and ELB. Just like kubernetes, these services are meant to run without much management from sysadmins, but fail in the![]() same ways. Take, for example, a misconfigured RDS instance that starts rejecting app connections. Your users notice in a big way, but AWS won’t notify you. It takes a monitoring tool so advanced that it will anticipate your needs and show you the unknowns in your environment.
same ways. Take, for example, a misconfigured RDS instance that starts rejecting app connections. Your users notice in a big way, but AWS won’t notify you. It takes a monitoring tool so advanced that it will anticipate your needs and show you the unknowns in your environment.
With over 100 services in AWS, and a DevOps culture of supporting the developers’ design, there are a lot of unknowns in configuration, setup, backups, and more. Each of these unknowns can strike at any time and cripple your system. Here are some specific examples that we catch without any configuration.
RDS Events. AWS will create events for failed backups, degraded instances, and much more. Most of them don’t show up as an email in the account owner’s inbox. If you’re not active on the APIs, you’ll miss them.
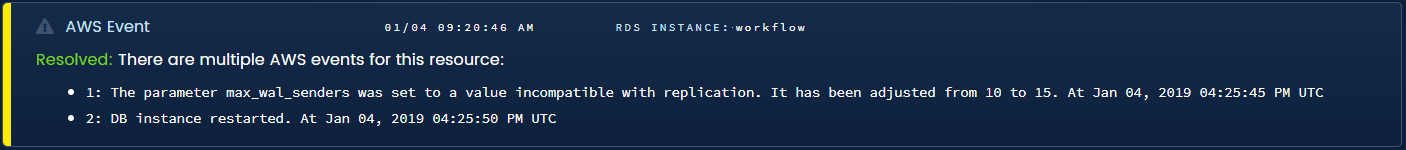
Blue Matador automated warning for hidden RDS configuration events
Dynamo Throttles. Unless you manually configured it recently, your Dynamo tables have limited capacity that doesn’t auto-scale. When you reach that limit, your application gets throttled. You may not notice, but your customers do.

Blue Matador finds throttling and hidden limitations in Dynamo
ELB Healthy Hosts. There are two kinds of major issues with ELBs. The first is that all the instances became unhealthy, most companies alert on this already. The second is that all of the instances deregistered because of auto-termination or accident, few companies alert on this. We added monitoring for these scenarios and more.

Blue Matador finds issues with ELB configuration and statistics
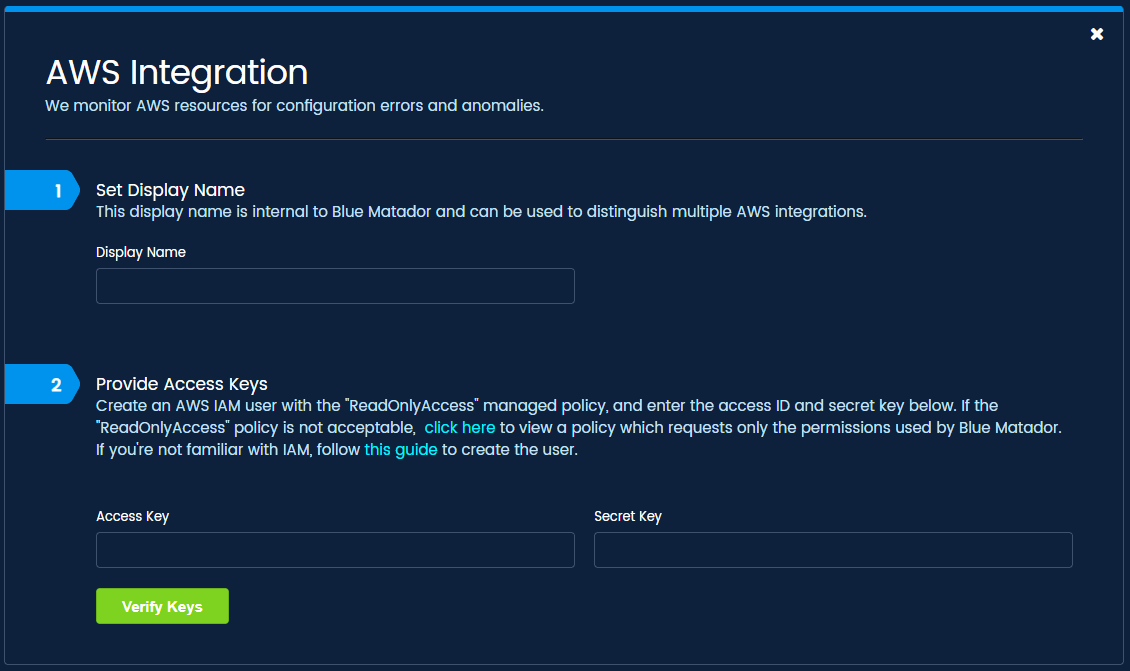
Our AWS integration is a simple form with 3 inputs: name, Access ID, and Secret Key. All we require is read-only IAM credentials, and you’re off to the races.
Correlate Events on the Timeline
“When is what.” If you can find when an incident started, you can often follow a few short steps to its originating code release, configuration error, or other root cause. This is almost impossible to do in most monitoring tools, because each step is buried within a sea of graphs and dashboards.
Forget the multitude of metrics, and focus exclusively on the deviations, the anomalies, and the oddities. Reading a short list of all the potential problems is a better way to do root cause analysis than searching through seemingly endless piles of data. I once spent 6 months trying to find a bug that crashed a random server in a cluster of twelve once every 2-8 hours. My problem wasn’t data, I had plenty of that. My problem was correlation.
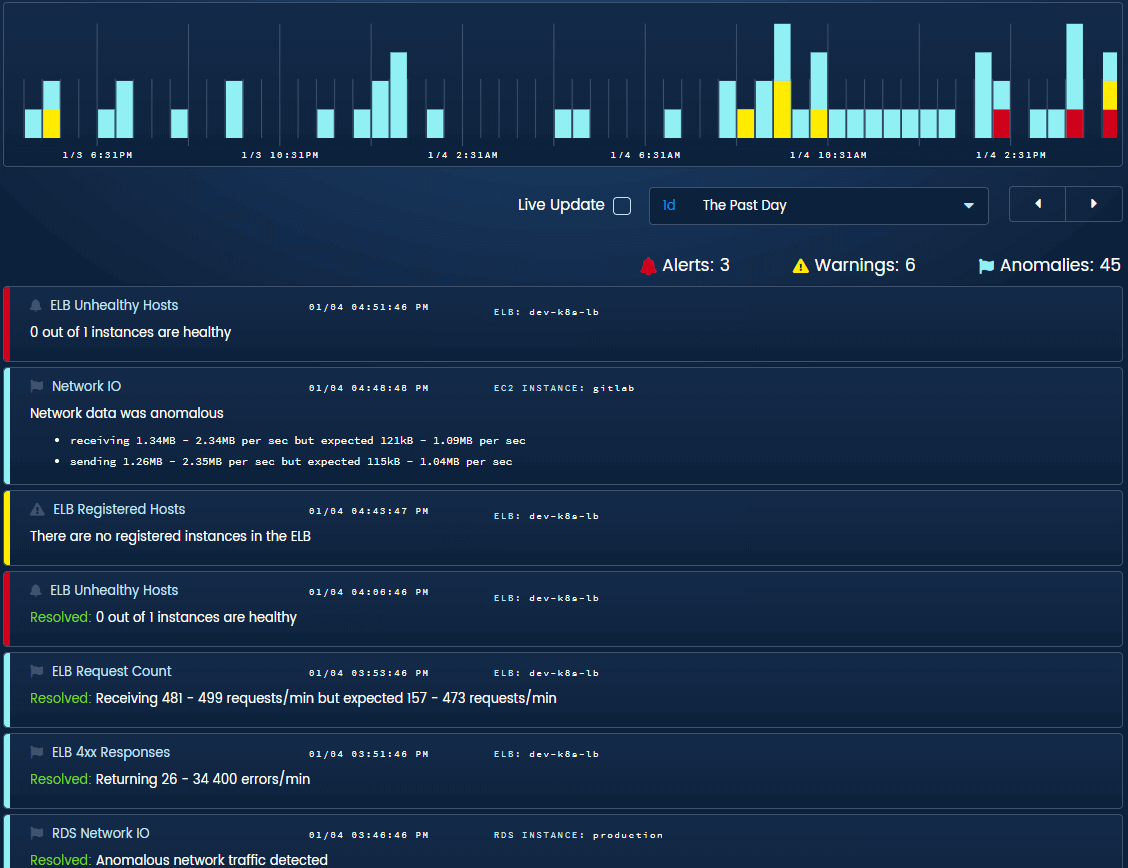
The timeline shows all events from your entire stack on a single pane of glass
In our timeline, you’ll notice three colors that represent our urgency hierarchy. We needed a system to make sure we gave out early warnings without waking people up for a problem that won’t happen for 2 days. Alerts (in red) are issues that need immediate manual intervention. Warnings (in yellow) are issues that will need attention soon. Anomalies (in blue) are things that probably shouldn’t have happened in a healthy system.
We collect and display tags, resource types, and other helpful information on each event in the timeline
If having a single graph is still too much for you, we also implemented a filtering system that works based on urgency, event type, or any one of the resource tags that we automatically discover and collect, like kubernetes namespace.
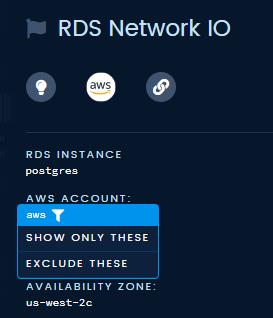
Events on the timeline can be filtered by urgency, event type, and resource tags
Watch for New Threats on the Dashboard
The most critical piece to monitoring a system is to know what’s broken right now. As an oncall engineer, that one piece of information dictates my priorities, meeting schedule, and the inevitable line of people at my desk. Our dashboard was built to show exactly what’s broken at this point in time, whether that be alerts, warnings, or anomalies.
As new events occur, they appear at the top of the list with a slick animation. As events are resolved (we detect resolves automatically, too), they are animated out in an even cooler fashion. You can use this as your own virtual threat board. Put it up on a tv in your team’s area to keep everyone apprised of the current status of production. Use it as a nice reminder for people to leave you alone as you fix critical issues.
It also shows 30 day trendlines for each urgency and your most frequent and least frequent events. That way, even if you miss something before it automatically resolves, you can still be aware that it happened. If that’s not enough for you, we also added integrations with Slack, PagerDuty, VictorOps, OpsGenie, and Amazon SNS.
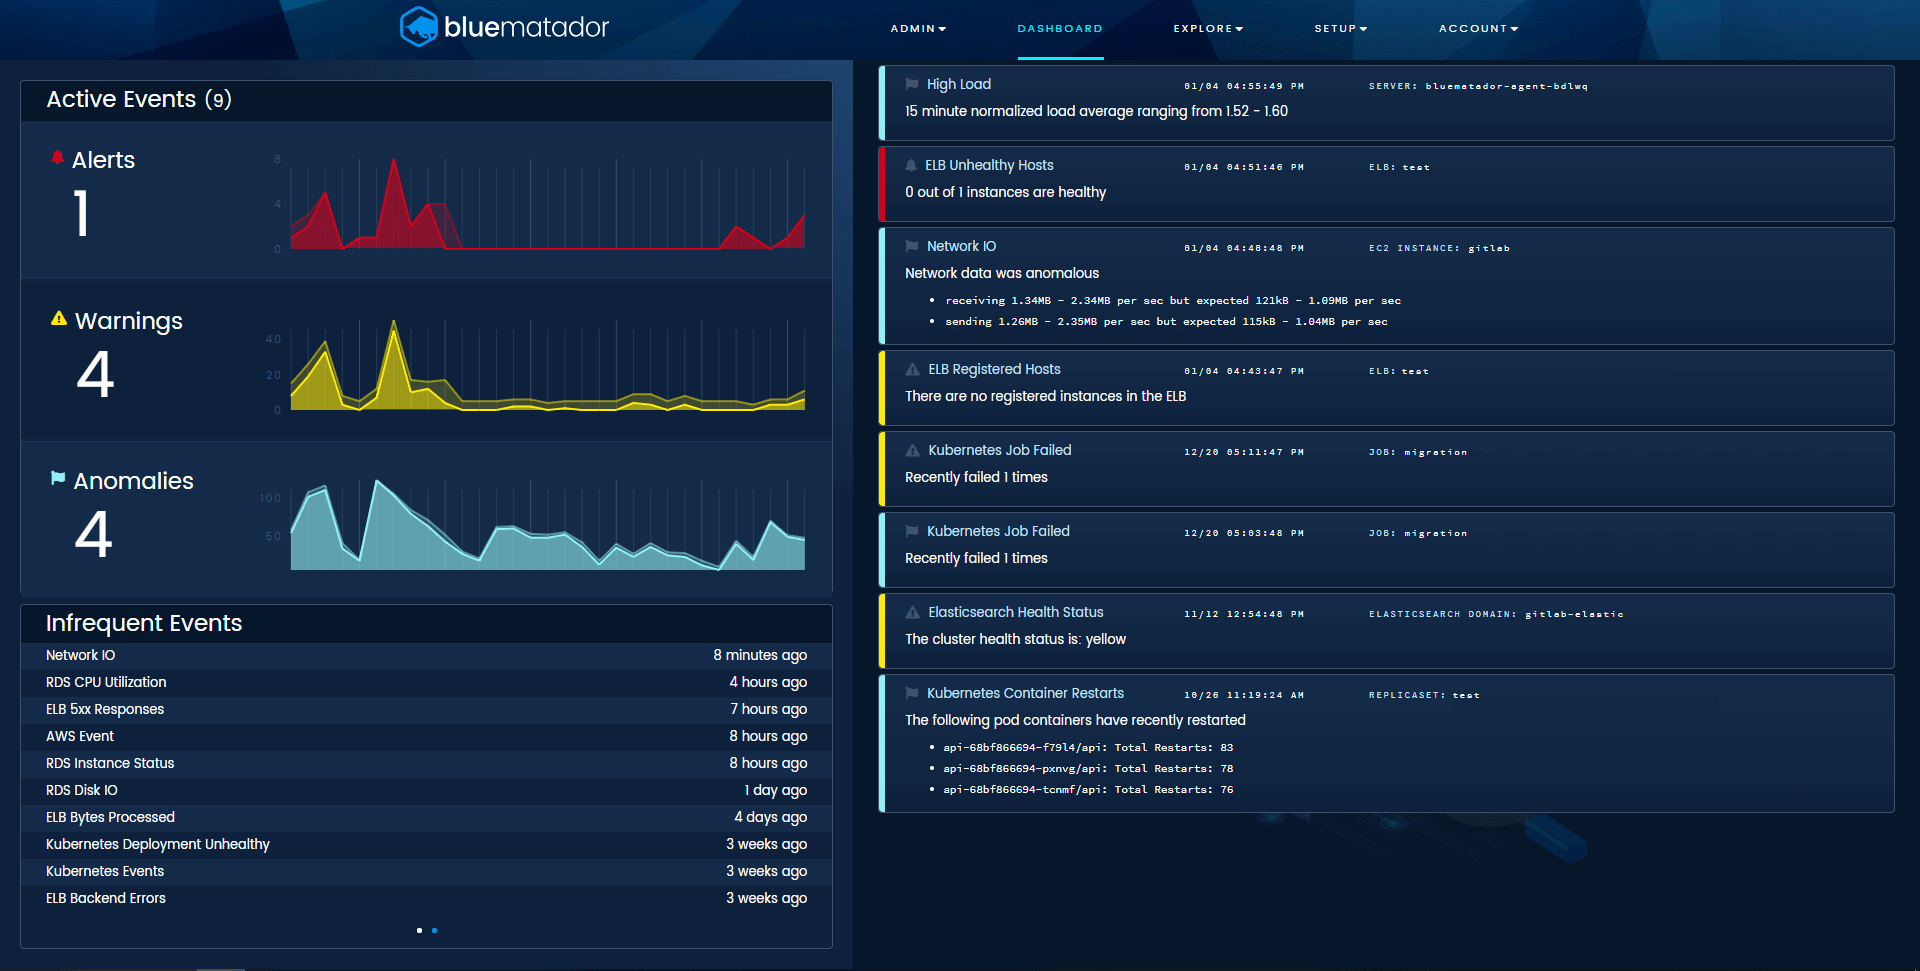
Blue Matador’s dashboard, showing active events, trends, and necessary information
The final thing that our dashboard has, and you’ll be lucky to see, is the count-up timer tracking days since your last alert. Inspired by all the shows and movies containing industrial accidents, our timer tracks your progress towards a goal of complete availability.
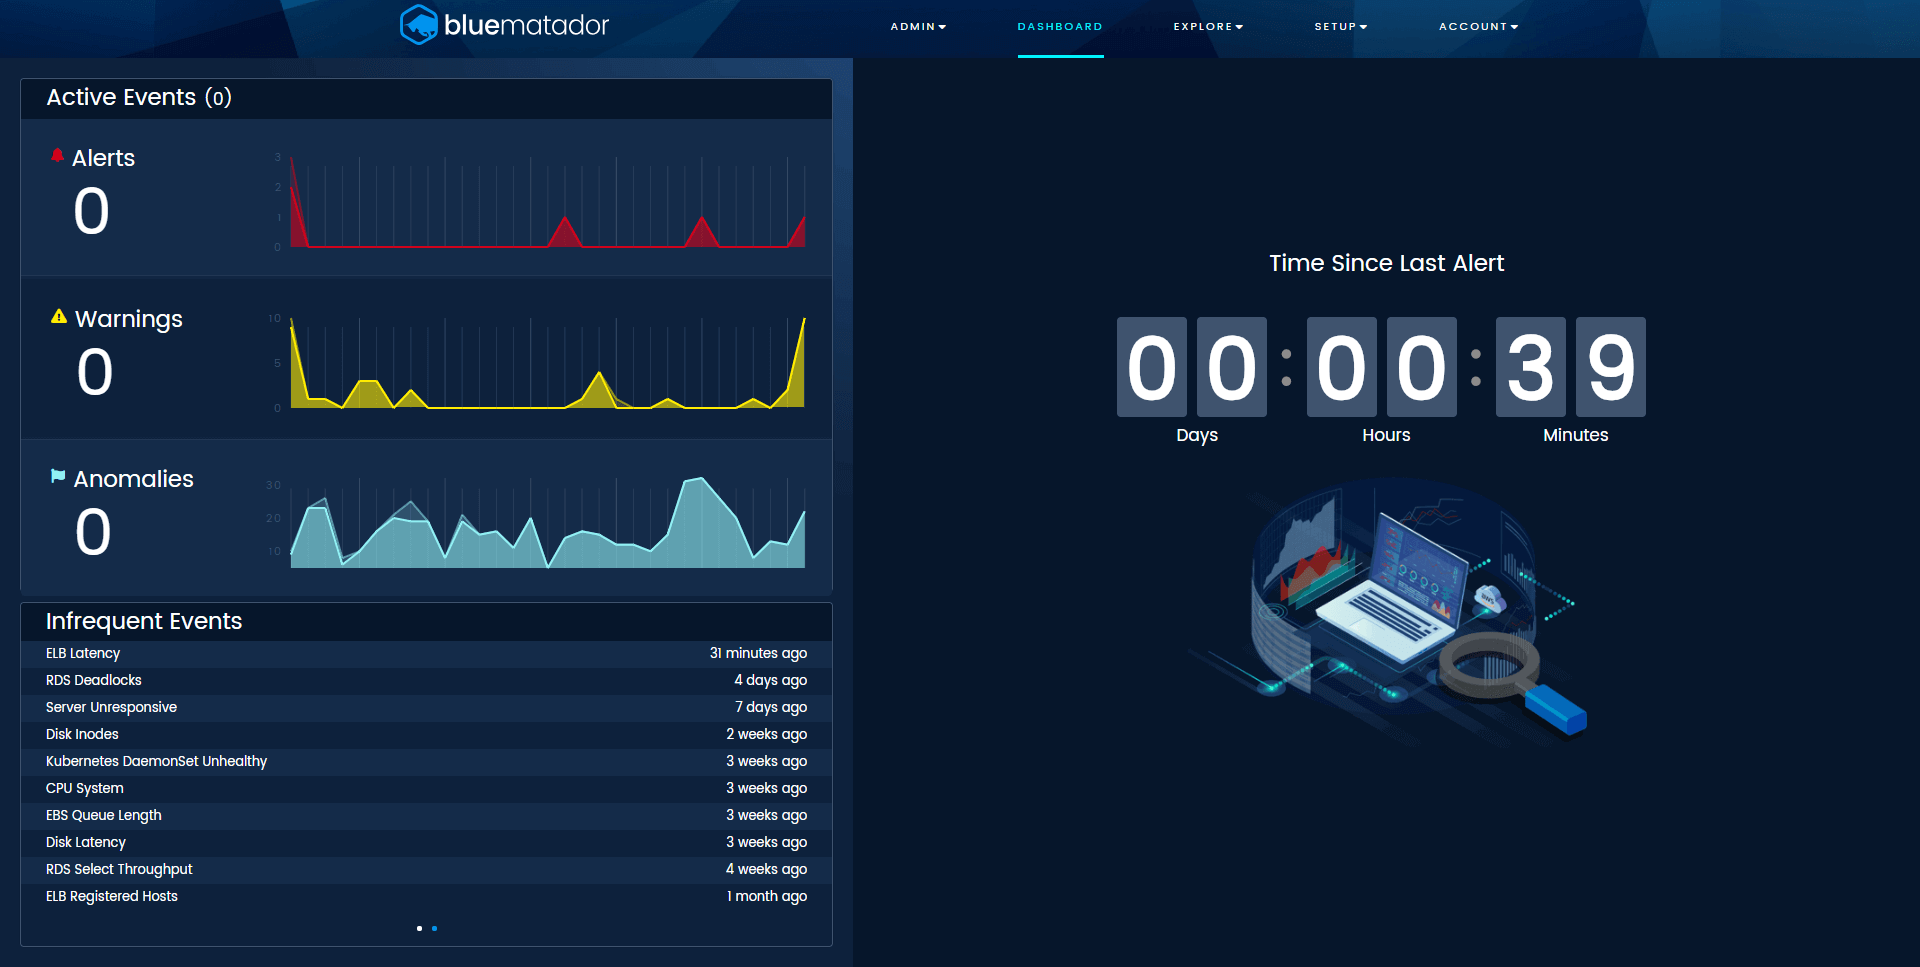
Blue Matador tracks the time since your last alert
Recap
This last year was a big year for Blue Matador. We integrated with kubernetes, AWS, a host of notification providers, and then created the two tools you need to stay on top of root cause analysis and current status of production. In essence, we created a monitoring tool that behaves like you would expect.
The next time you’re sifting through a torrent of metrics, graphs, and dashboards, looking for that glimmer of root cause, remember that there’s a better way to find the unknown in your infrastructure.


