
Remember the customer who reported a hard-coded packet per second (PPS) limit in AWS? His use case was a reverse-proxy server to a very active database cluster, complete with heartbeats, keep-alive connections, and a heavy load of queries and traffic. When the network throughput was sustained for an hour or so, the throughput would drop despite increasing demand.
After reacting to the problem for several months, talking to AWS engineers, and doing root cause analysis of his own, our customer concluded that the proxy instance size had a hard limit of 50,000 PPS after an initial credit-gaining period — much like CPU credits in AWS. In response, he increased the size of all the proxy servers, and the problem disappeared entirely, ending a quarter-long issue.
The theory of hard limits in AWS makes a lot of sense. AWS is known for over-subscribing their hardware, which necessitates certain usage limits to be as fair as possible. My test, as part of this blog series, was to see if I could find that limit, reproduce the credit mechanism, and publicize the unpublished limit in AWS.
This is the second post to our series investigating PPS measurements in Amazon EC2. Here are the other posts in the series:
- How many packets per second in Amazon EC2? (introduction)
- EC2 packets per second: guaranteed throughput vs best effort (this post)
- Packets per second in EC2 vs Amazon’s published network performance
- Payload size doesn’t affect max PPS limit on AWS
- PPS spike every 110 seconds on EC2
- Using t1/t2/t3 unlimited to increase packet limitations
Packets are Not the Same as Bandwidth
Before I get into the actual results from the test, let me specify that I’m reporting on packets per second, not bytes per second. If you’re not familiar with packets and bandwidth, there’s a big difference.
For a complete rundown on packets, you can read about the OSI model.
Simply put, packets are bytes that are sent on a network. Every packet contains a number of headers, like sequence number, checksums, and protocol as well as the actual payload of the packet - the bytes your program actually intended to send over the network. Packets are used for all network communication from web traffic to email, and from computers to cell phone networks.
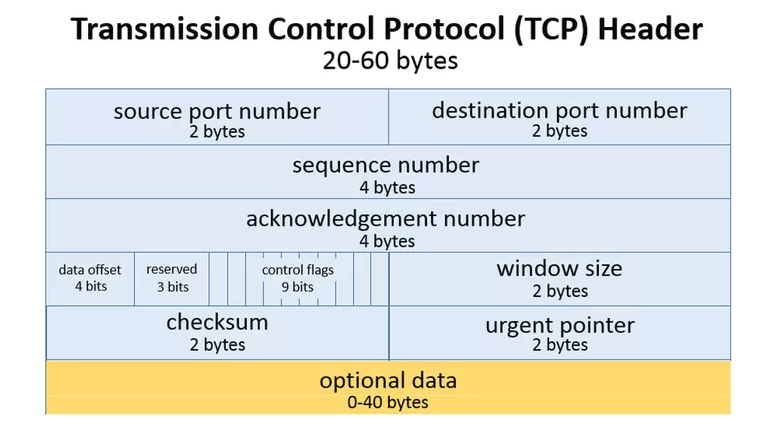
When software applications send information across the network, chunking and sequencing that data into packets happens in the OS automatically. Depending on the protocol, the OS will even verify that the packet was received successfully, or retransmit if necessary. The OS is also in charge of limiting the size of the packet, including headers and payload, to the network’s Maximum Transmission Unit (MTU). The default is 1,500 bytes, but can be increased to support jumbo packets at 9,000 bytes or higher.
The relationship between number of packets and number of bytes (bandwidth) depends entirely on the type and quantity of data being sent. Packet headers vary between 20 and 60 bytes, leaving 1,440 to 1,480 bytes for the payload. However, if there aren’t 1,400+ bytes to send in the payload, the packet could be much smaller. If your application is sending a lot of data in very few packets, like when downloading large files from S3, the number of packets won’t be nearly as limiting as the number of bytes. On the other hand, if your application is sending a lot of packets with very little data, like when doing heartbeats, TCP handshakes or FIN/ACK packets, then the limiting factor will be number of packets.
Packet throughput and byte throughput are not correlated, unless payload and demand are held constant. The results of my test, given next, are solely about packet throughput, not byte throughput.
Guaranteed Throughput
vs Best Effort
After I started the test outlined in the intro to this series, I began watching the graphs excitedly to see what would happen. At the first dip in network packets, I prematurely called the customer saying I had reproduced the issue and confirmed a credit-like limit on packets. I was excited to have confirmed the problem and be doing the test, because Blue Matador is always looking for undocumented limits and scaling problems to alert on automatically.
Unfortunately, it was definitely premature. I let the test continue running while I got dinner. When I came back I found the drop had gone away, and the system was working fine. In fact, over the next 2 days, the drop happened multiple times, but always rebounded after an undetermined amount of time. Keep in mind that these systems had consistent load across the entirety of the test.
Here is the graph of network packets out over all tested instances for the entire duration of the test. Notice that each one of them has a high threshold and a low threshold.
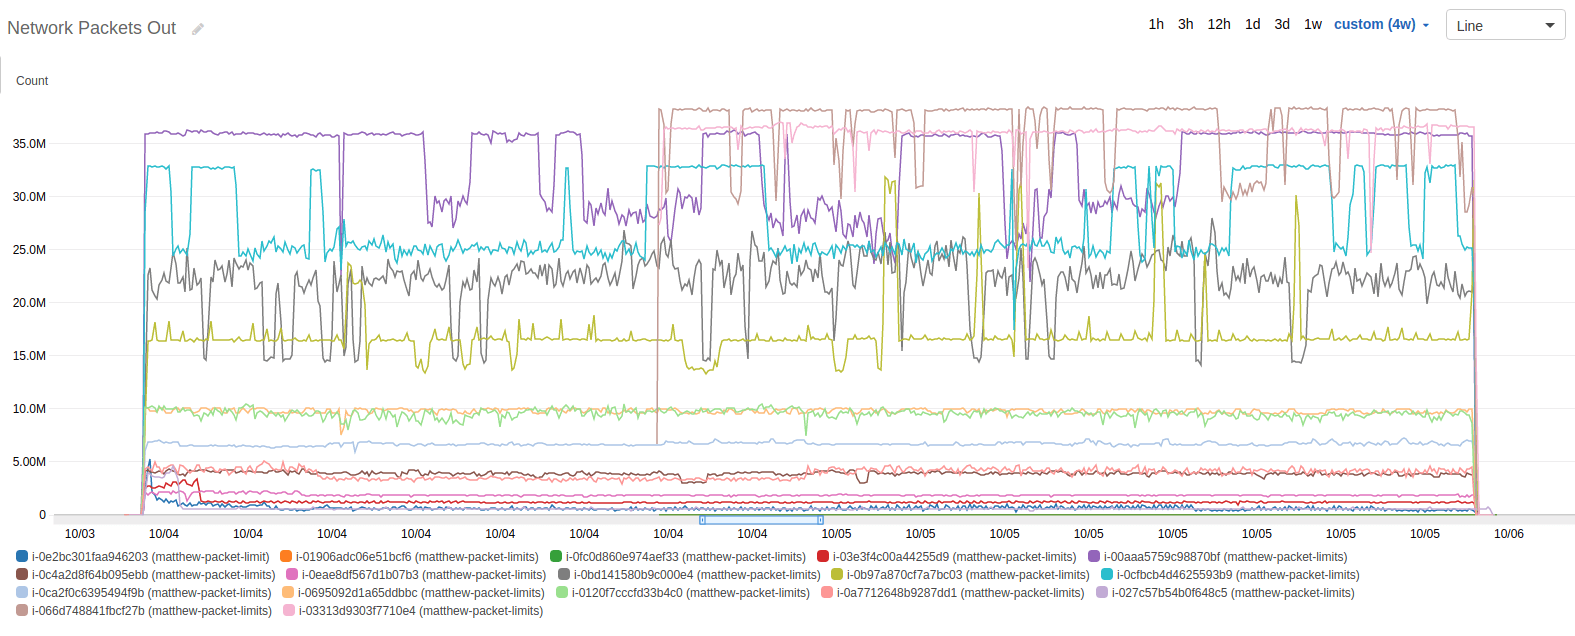
The lines appear to ride either the high or the low threshold at any given time, and switch between them at random intervals. The shortest interval was a single 5 minute period, and the longest interval was several hours.
In light of this discovery, I stopped thinking in terms of hardcoded network limits and packet credits, and began thinking more about a guaranteed PPS and a best effort PPS. The graph certainly seemed to support it, so I dug in to my second-by-second statistics to confirm.
You can do the same calculations using the data in our Github repo, though you’ll be very likely to encounter spreadsheets that don’t scale well. I ended up using a combination of LibreOffice for large data, PHP for computation, and Google Drive for Graphing and calculations in the summary data set. Here is the Google doc with summary data set.
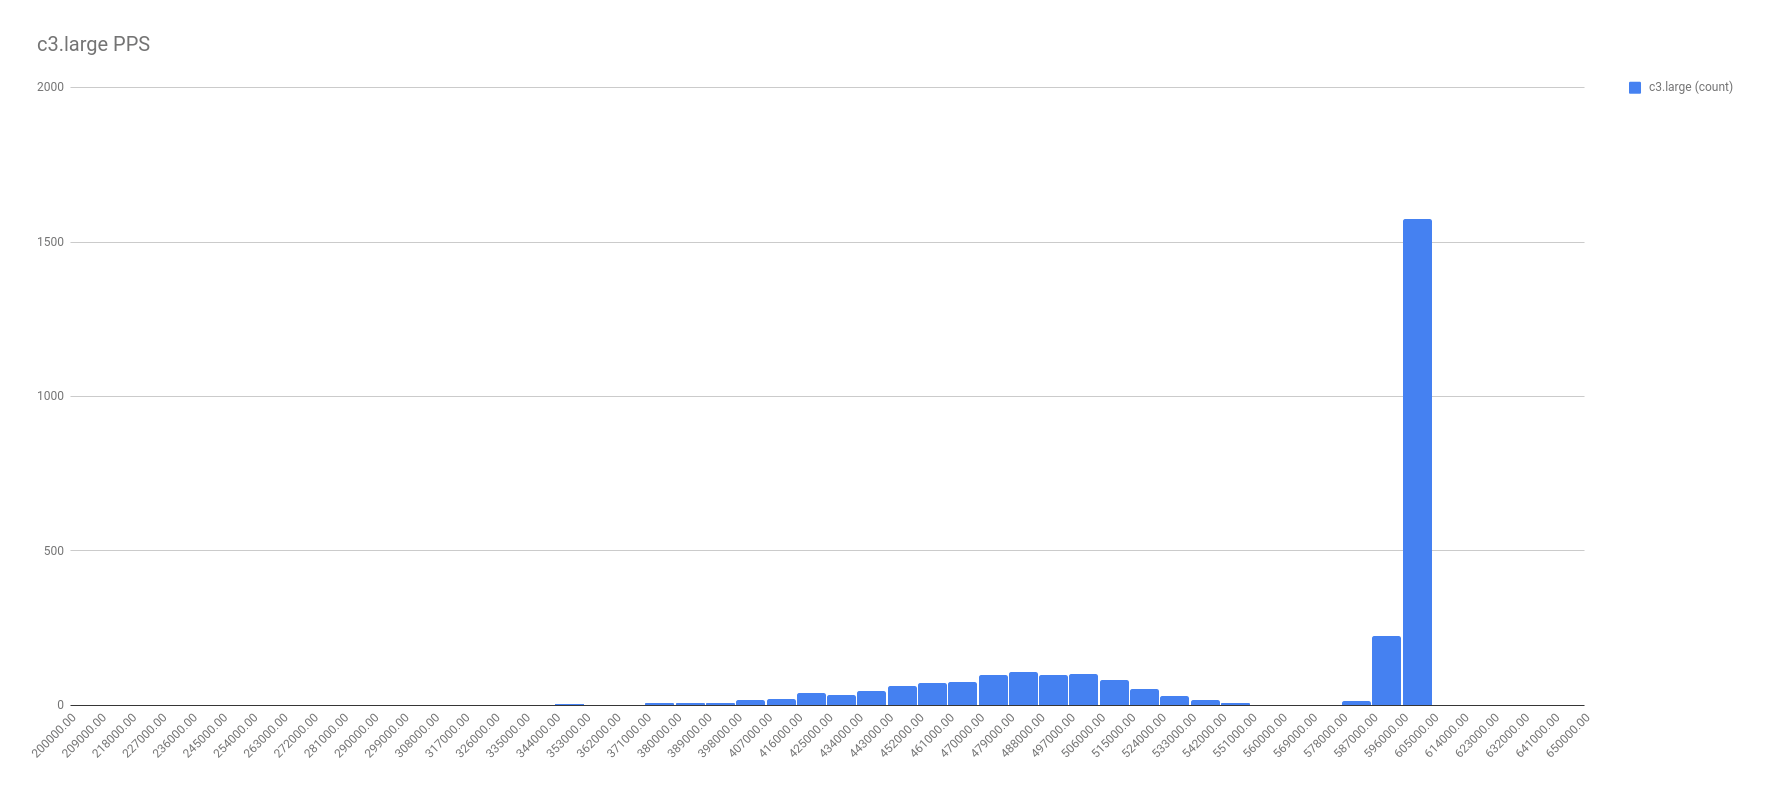
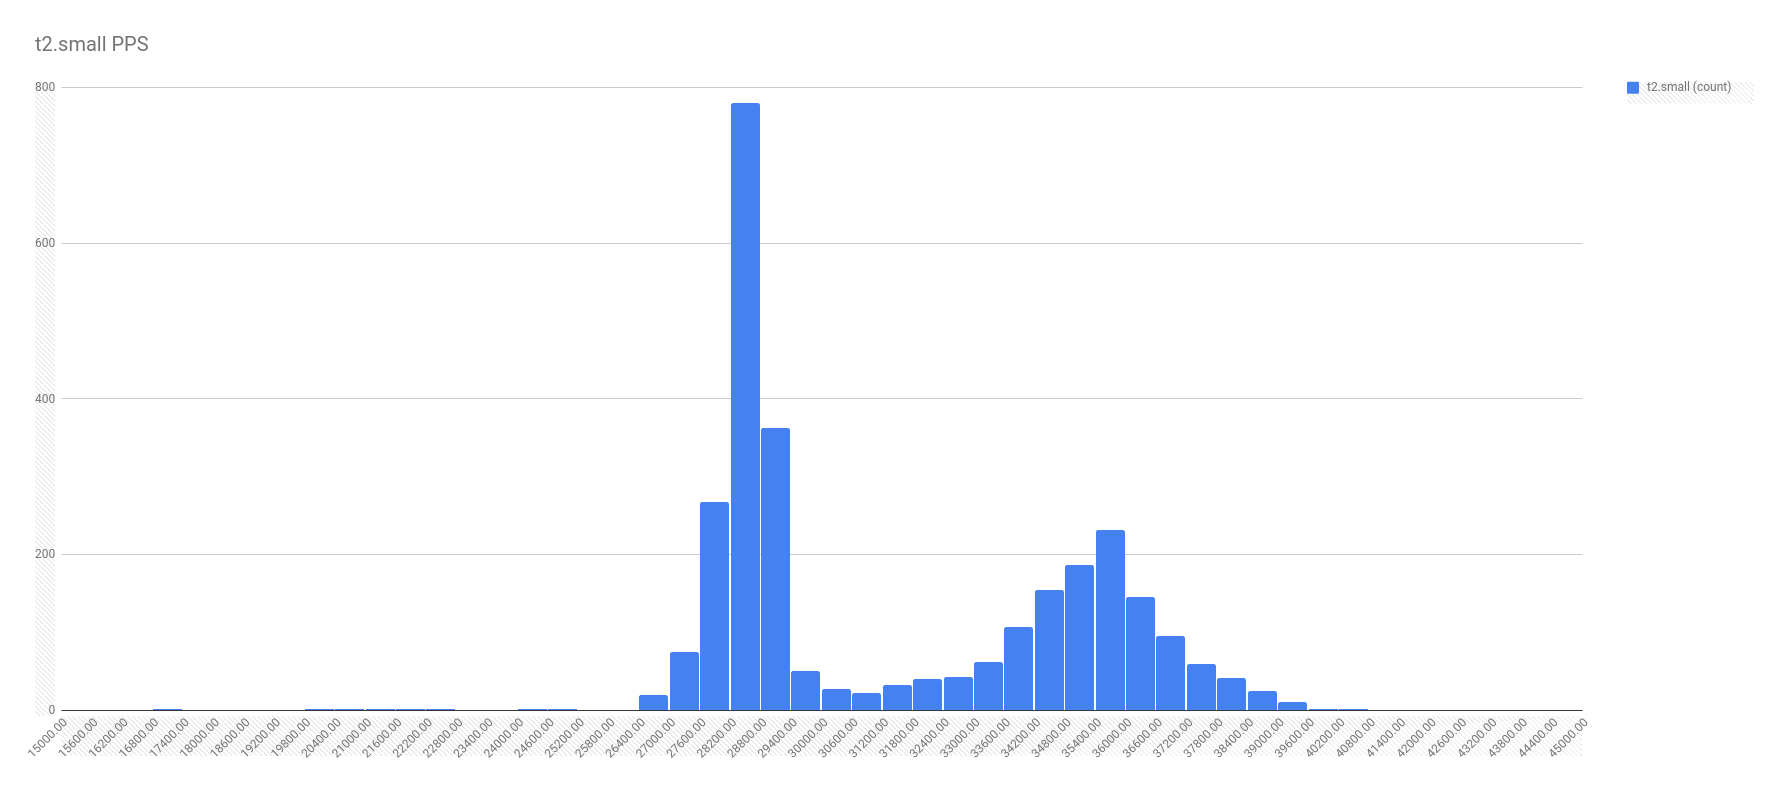
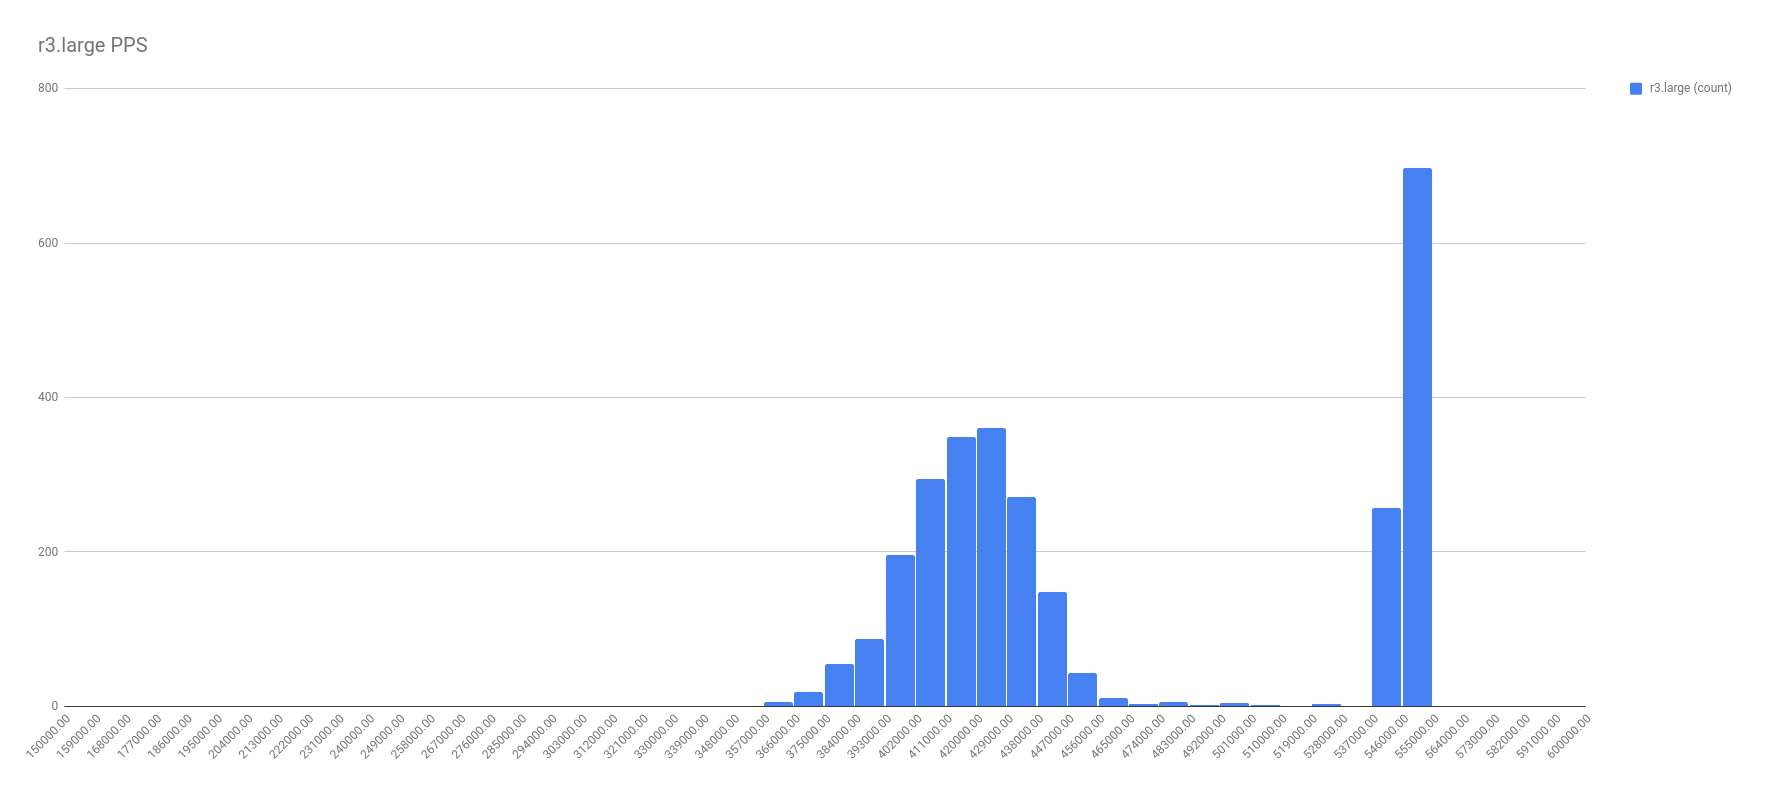
First, let me show the more illuminating histograms with data frequency of PPS by instance types. In these graphs, look for the two localized maximums — the two bell curves. It’s these bell curves that proves the existence of the best effort vs guaranteed throughput.
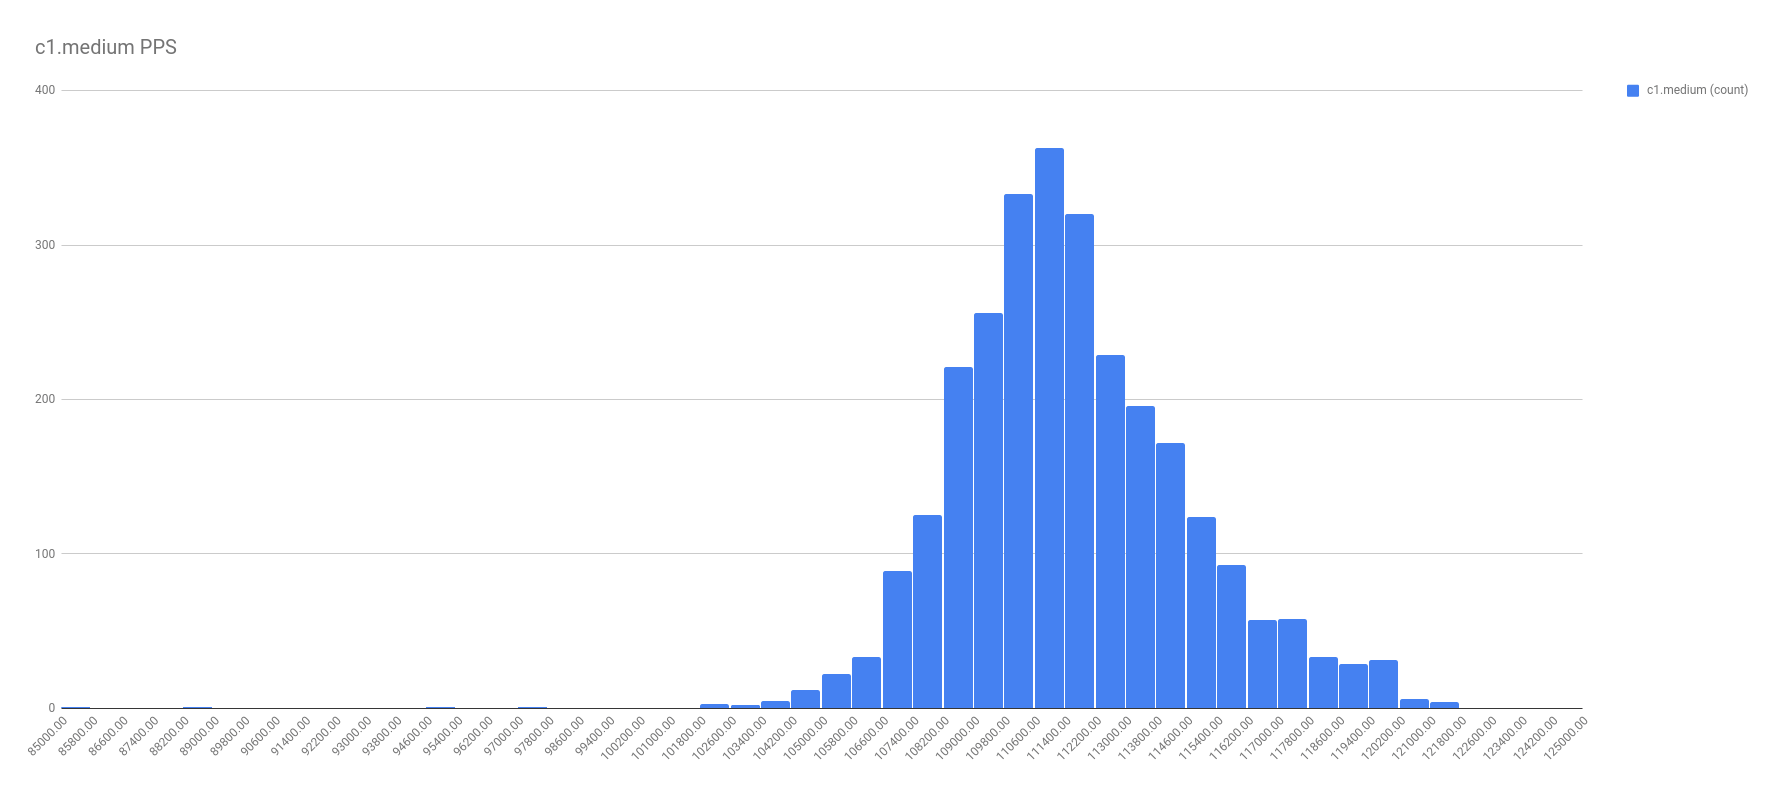
In all fairness, not all the graphs were this cut and dried. For example, take a look at the PPS for c1.medium. I chose a spot on the right tail where it seemed another local maximum might be, and called that the split. Not perfect, and I’m sure there’s a better calculation for it, but I’m no math major.
Also included in the spreadsheet is a summary table. None of the cells are equations, because Google can’t handle the 2.720.000 data points, but they are in fact actual calculations using the second-by-second data collected during the tests.
Here is the final output of the test. The columns you’ll want to pay most attention to are the averages, because those will be your theoretical max PPS for both the guaranteed and the best effort numbers. It’s sorted by average of best effort, which roughly matches the instance types up just how you might expect them to.

The guaranteed limit for c5.large is 823,806 packets per second and the best effort is 994,007. You could look at this like “How dare AWS throttle me!” or you could thank them for giving the extra 20.66% throughput when they’re not busy. I’m more of a glass half-full type of guy.
Monitoring for the Max
Now that you have this data, for at least the instance types I tested for, it would be wise to go setup Cloudwatch alerts for these PPS limitations. You don’t want to find yourself maxing out your packets per second, looking at your bandwidth graph which looks normal, and wasting months on not knowing what to do.
<shameless plug>
Alternatively, let Blue Matador monitor your AWS infrastructure for you. We monitor EC2 instances (including network traffic), RDS instances, ELBs, Cloudfront, Route53, and a whole lot more. Setup takes less than an hour, because we create thresholds for you.
</shameless plug>
Acknowledgements
- TCP Headers image taken from
https://www.lifewire.com/tcp-headers-and-udp-headers-explained-817970


