
I don’t know what to say about this post… I found something weird while investigating PPS on EC2. It seems to correlate with CPU credits on t1/t2/t3 instances, but is consistently inconsistent in presentation. It only shows up when you track the stats yourself, because Cloudwatch doesn’t show the 1-second granularity needed to see these numbers.
The reason I don’t know what to say about the post is because I don’t know what’s causing it. I suspect it’s CPU credits, but I can’t find evidence that it happens on all instances where CPU credits run out. I would love to hear if you have this problem in production (not just a benchmark environment like mine). Leave a comment, chat me, or let me know some other way.
This is the fifth post to our series investigating PPS measurements in Amazon EC2. Here are the other posts in the series:
- How many packets per second in Amazon EC2? (introduction)
- EC2 packets per second: guaranteed throughput vs best effort
- Packets per second in EC2 vs Amazon’s published network performance
- Payload size doesn’t affect max PPS limit on AWS
- PPS spike every 110 seconds on EC2 (this post)
- Using t1/t2/t3 unlimited to increase packet limitations
Granularity Matters
I’m about to show you all the graphs I looked through at the 1-second granularity I used. Let’s first take time to recognize that none of the insights these graphs show would be available if I had used only Cloudwatch to monitor my data. Cloudwatch, by default, has a 5-minute granularity. You can upgrade to 1-minute granularity, but you’ve got to enabled the enhanced monitoring on every single resource in the console, including resources you have yet to create.
When you don’t enable the enhanced monitoring, Cloudwatch probably does one of two things (I’m not sure which). Either they sample the data, giving you not only fewer data points but also less accurate data; or they aggregate the data away using mins, maxes, averages, or medians. I’m not talking about the function you choose when showing a graph in Cloudwatch, either. I’m talking about how they choose to scramble your data before they ever even store it in the time-series database.
If you find yourself unable to locate the root of a problem, your granularity may be to blame. With more detail comes more insights. With systems as complex as multi-region, highly available applications running on AWS, higher granularity is the equivalent of 20/20 vision. Without it, your blurry graphs will be misinterpreted.
Long rant over….
PPS Profiles of EC2 Instances
As you look through these graphs, look for patterns. The prevailing pattern I noticed is the equidistant spikes toward the right hand side of most graphs. When you’re looking at any one graph, the spikes are generally the same size and magnitude. Take care to notice which of these graphs (sorted by increasing instance vCPU capacity and memory) exhibit the equidistant spike behavior.
Now, the flurry of graphs…
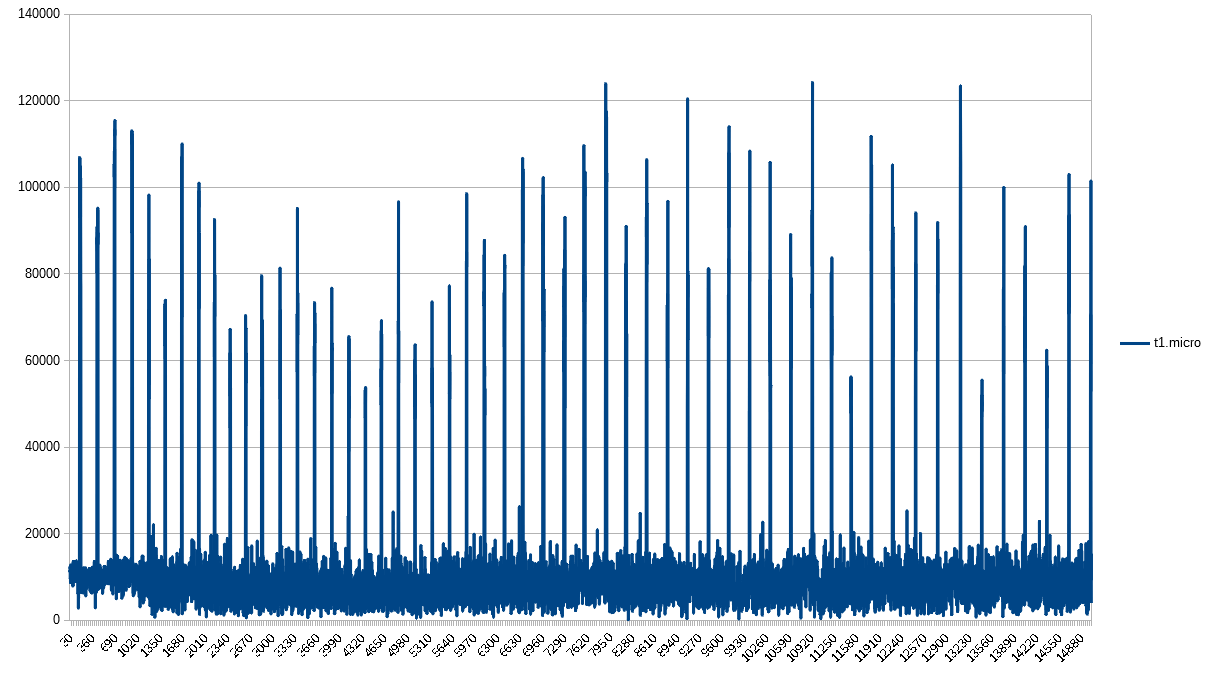
The t1.micro definitely both suffers from CPU credit exhaustion as well as the equidistant spikes.
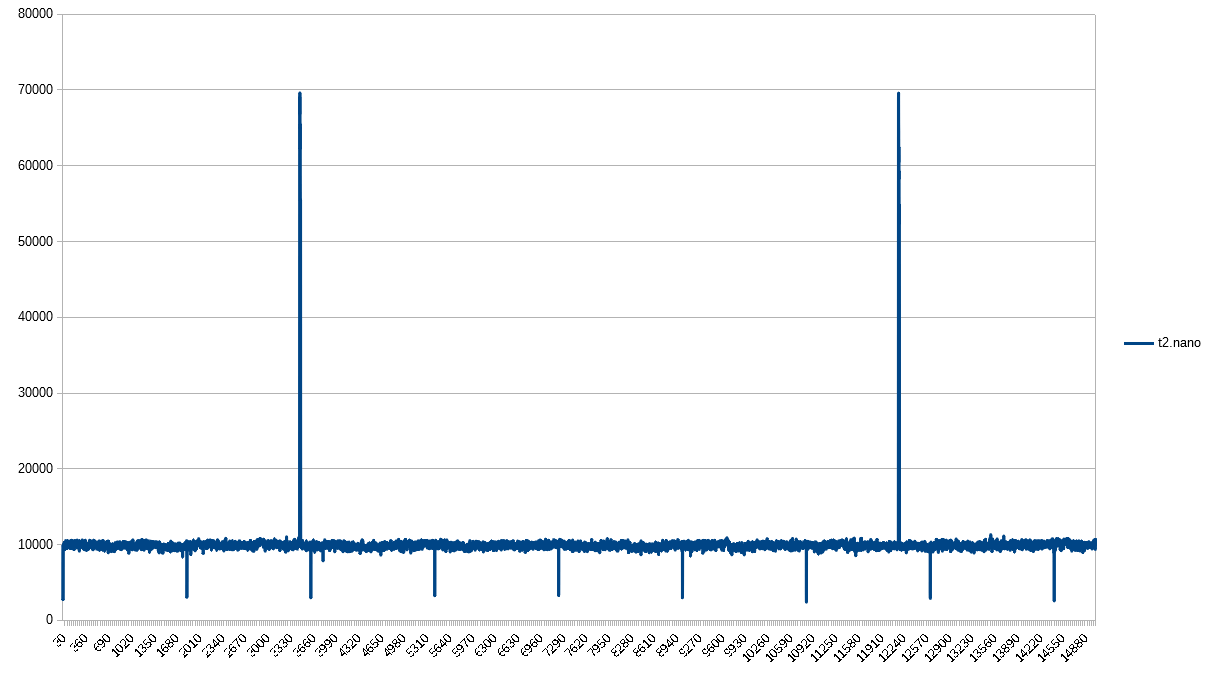
Immediately, we encounter a deviation in pattern - previously noted as “consistently inconsistent”. The t2.nano has credit exhaustion, but has another pattern emerge entirely over the same span of time. It has both positive and negative spikes, equidistant to their own type. These do not line up with credit exhaustion. I honestly have no idea what’s going on here, but am positive that this anomaly would be hidden by 1-minute or 5-minute granularities.
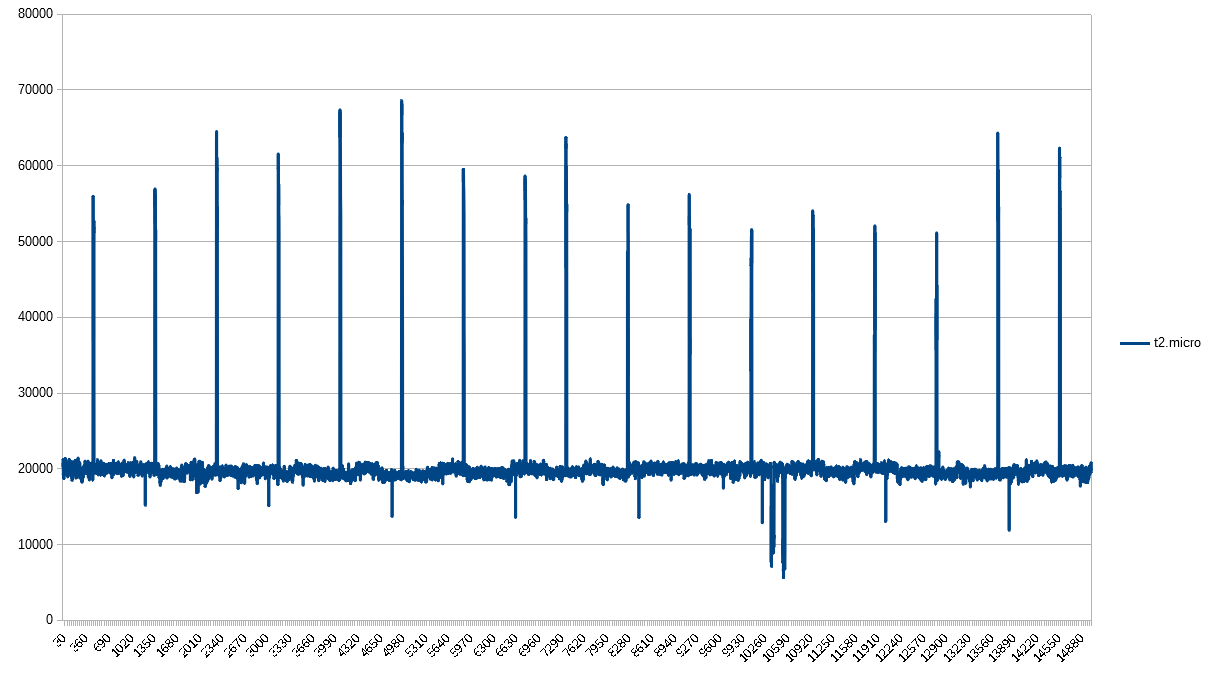
And back to the equidistant spikes. The t2.micro looks nothing like the t2.nano. Interesting, though, that the spikes are spaced out more, despite having the same number of data points over the same amount of time compared to the t1.micro.
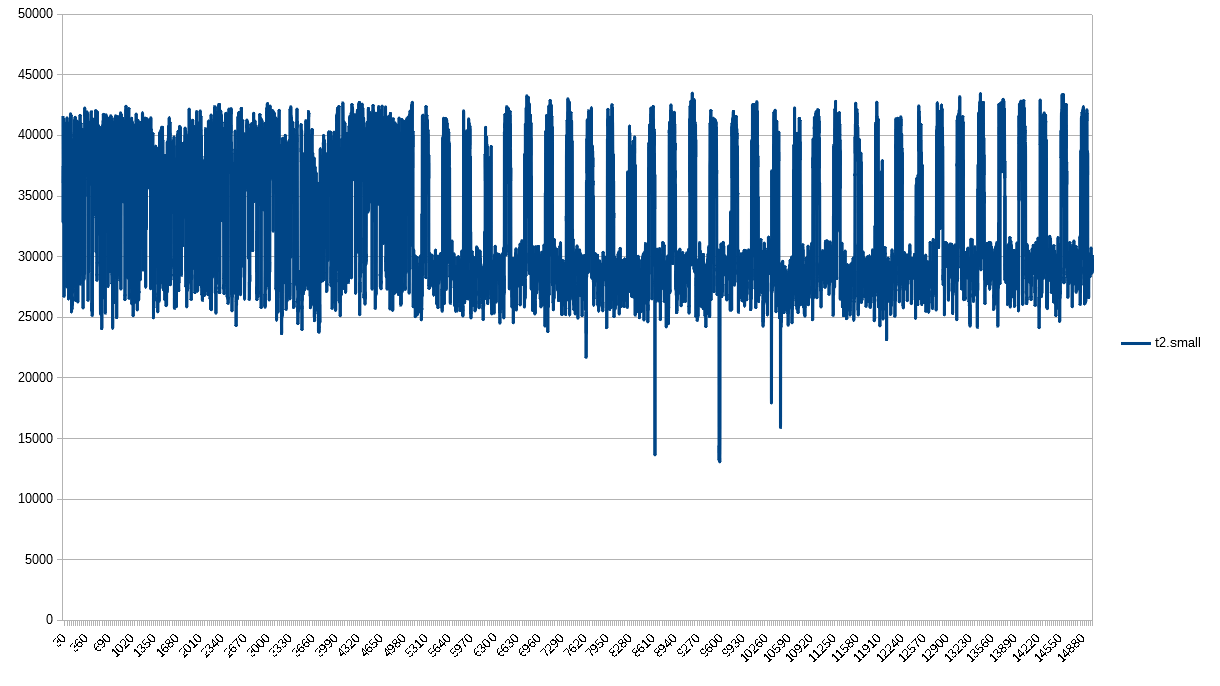
And we’re deviating again. Unlike previous instances, the t2.small was incredibly spikey at first, and then calmed into the pattern I attribute to CPU credits. In my mind, this highlights the oddity of the first few instances - their CPUs seemed to be exhausted from the start.
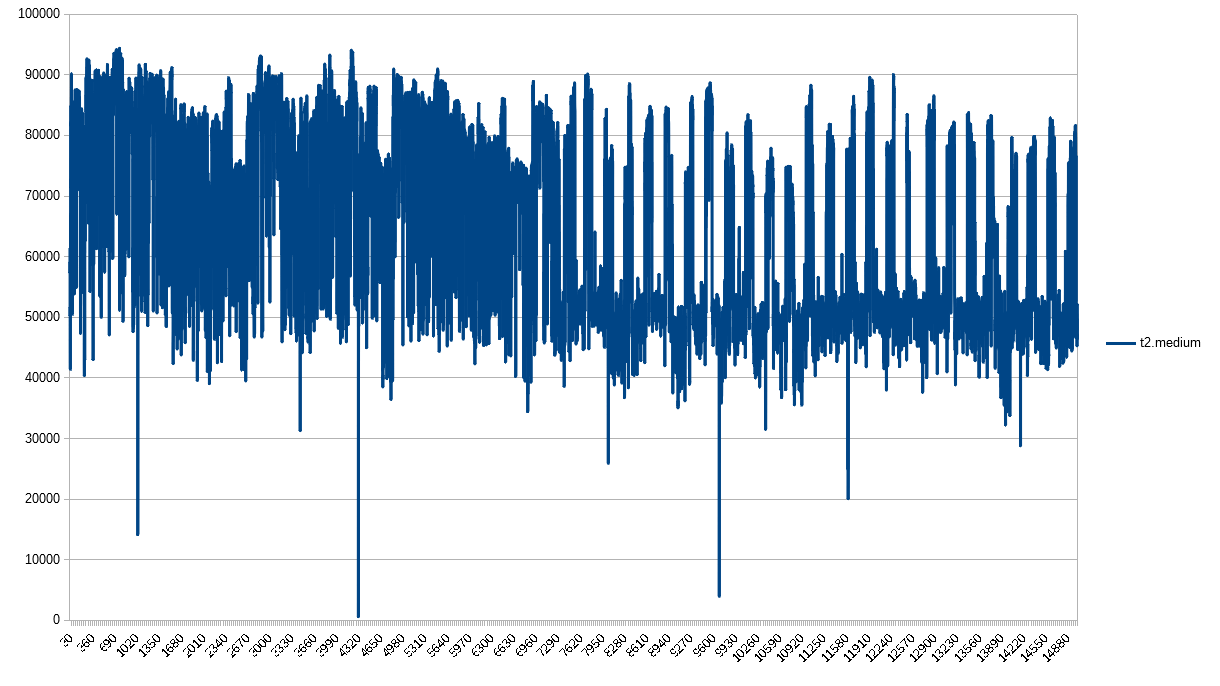
The t2.medium looks a lot like the t2.small. Consistently inconsistent, Amazon.
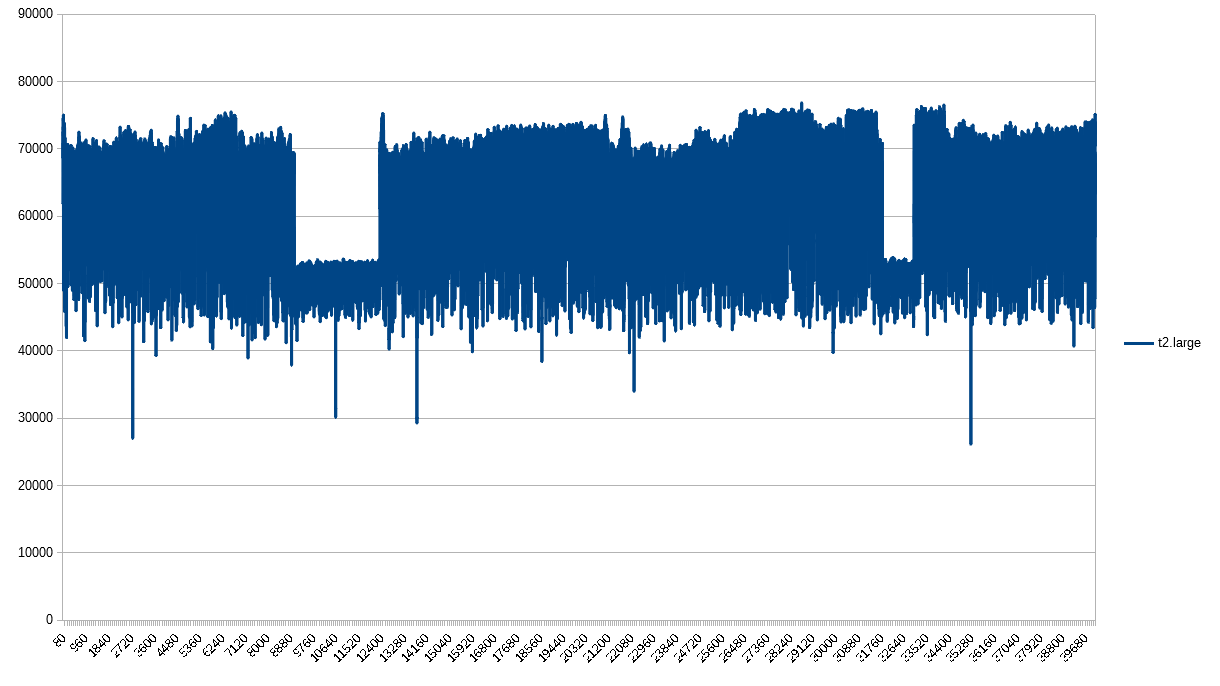
The t2.large has tracked CPU credits, but showed a different pattern. This is the first instance where I included more data points to the detriment of graph readability, but to show that the consistent drop in PPS is a pattern throughout the entire test, not just an anomaly on the left hand side. I suspect this is the best effort vs guaranteed throughput I wrote about in a previous post in this series. That said, why no consistent CPU exhaustion?
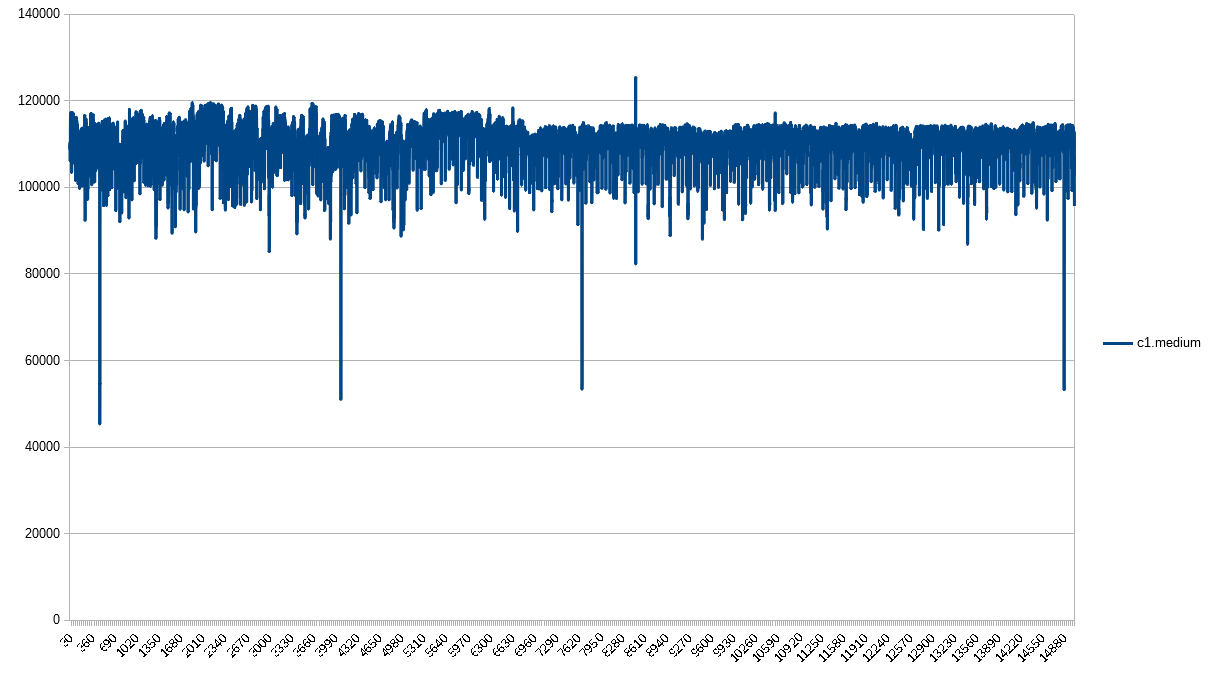
The c1.medium is the first of many that don’t have CPU exhaustion, so I expected it to look the way it does. No surprises here.
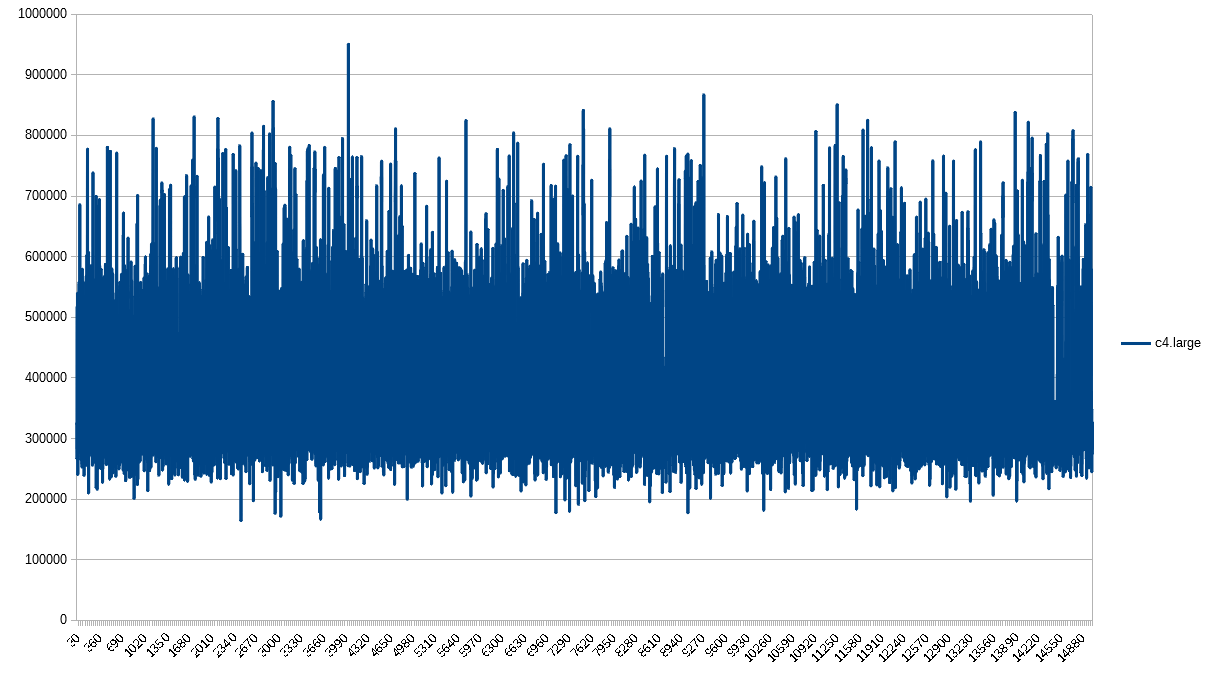
The c4.large also has no surprises. Some spikes here and there, but fairly predictable.
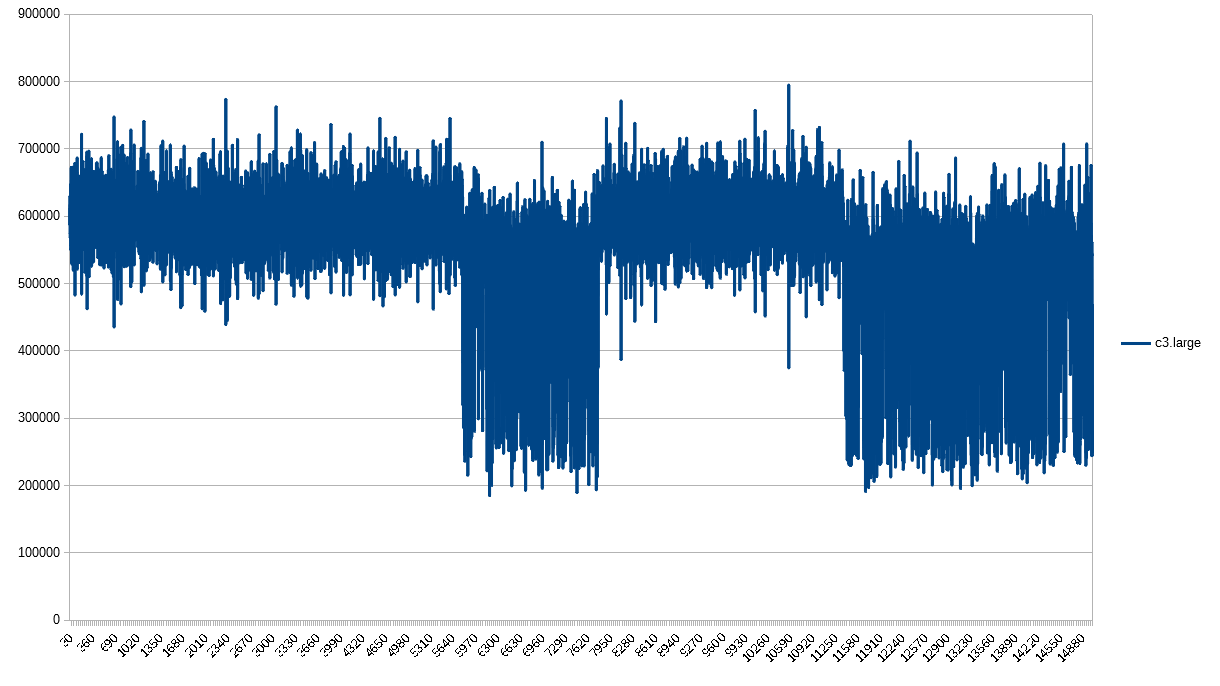
Just when we had a good thing going, c3.large kicks us in the teeth again. I can’t explain what’s happening here. No CPU credits, no special hardware, same test as all the other instances, but it has a different 1-second granularity profile for network packets.
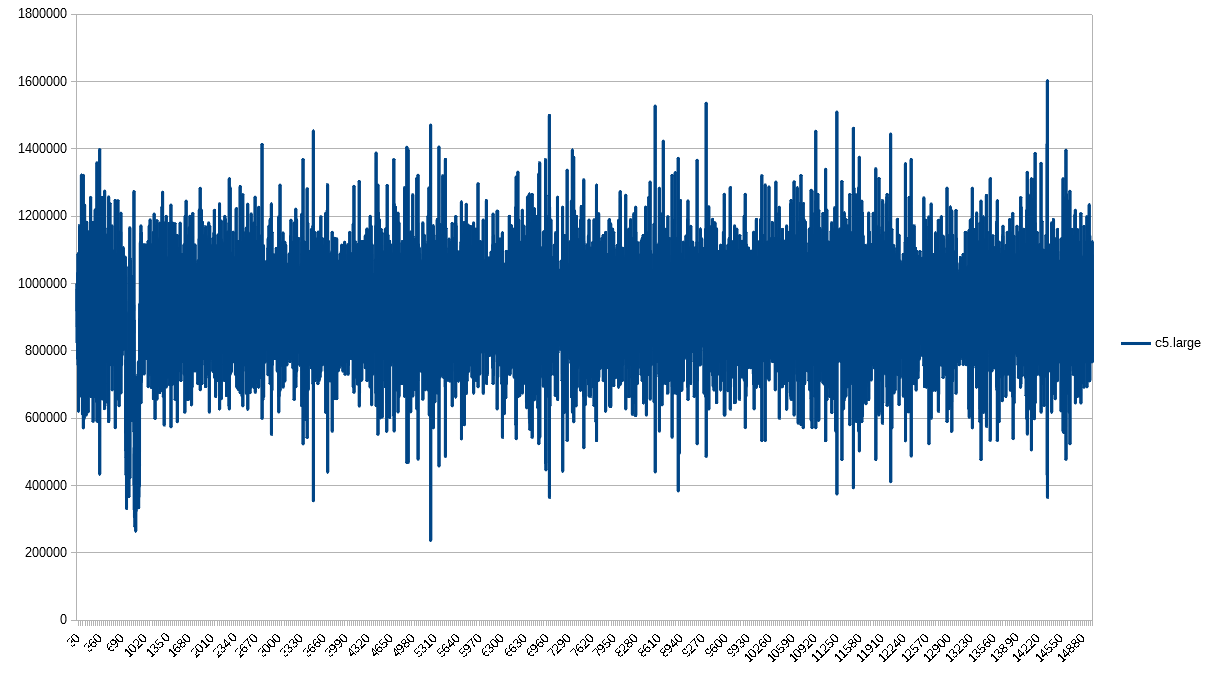
The c5.large reminds me of an accordion for no good reason.

The m1.large most clearly depicts the guaranteed throughput and best effort of all these instance types. You can see definite steps of throughput. They don’t happen at a set frequency, but they do have a very clear upper and lower bound.
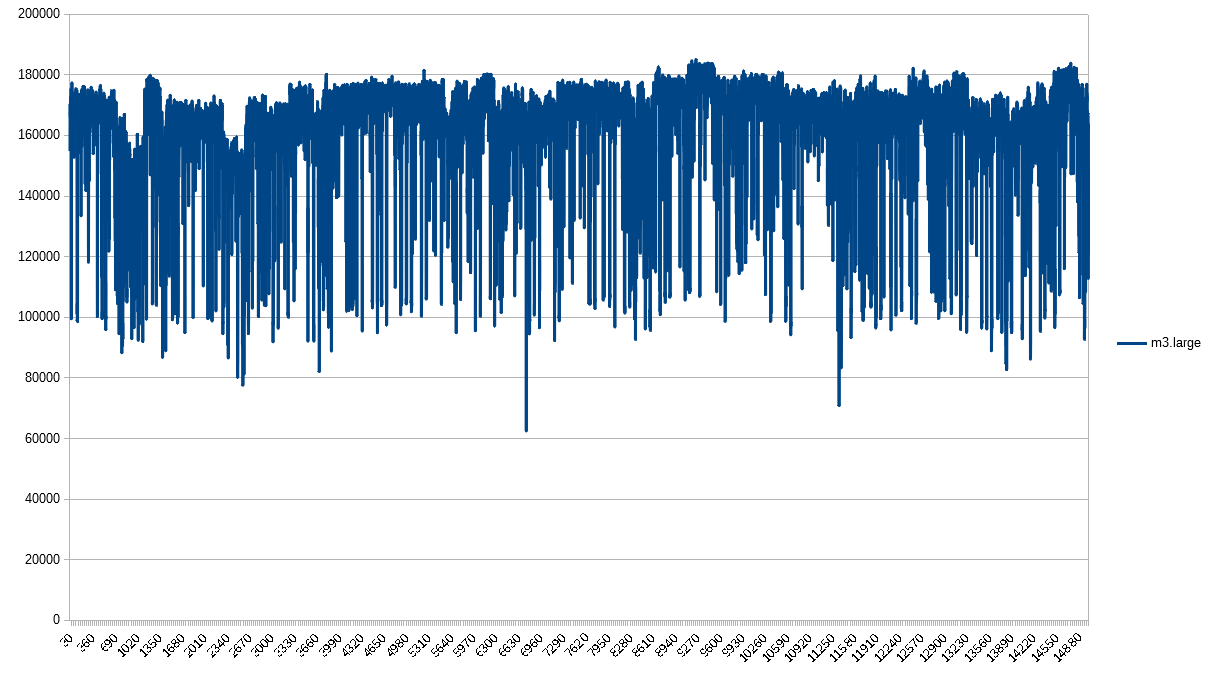
The m3.large is its own beast. I hope you’re noticing that each instance type appears to have its own profile. For m3, the upper bound is pretty well defined, but it appears that the lower bound is inconsistent, completely unrelated from the upper bound, unlike what we saw in the c3.large and m1.large profiles.
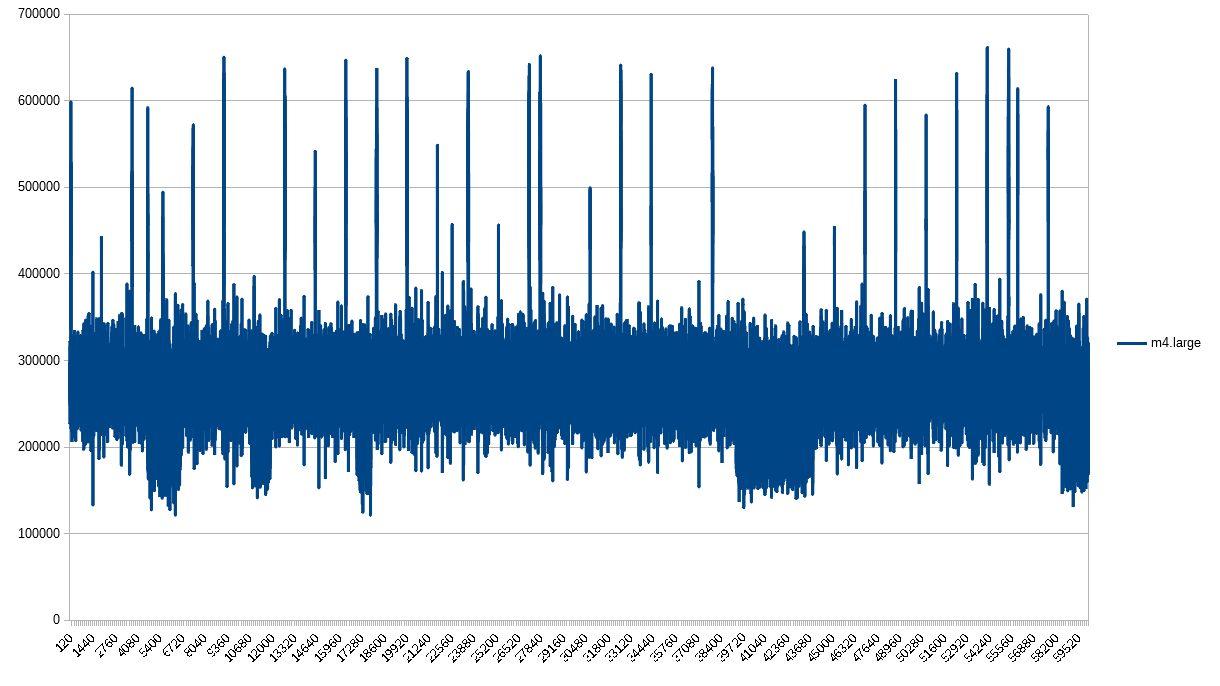
The m4.large does NOT have CPU credits. Its CPU does NOT get throttled. Yet here it is with the equidistant lines that I attribute to the CPU credits found in t1 and t2 instances. It makes no sense!
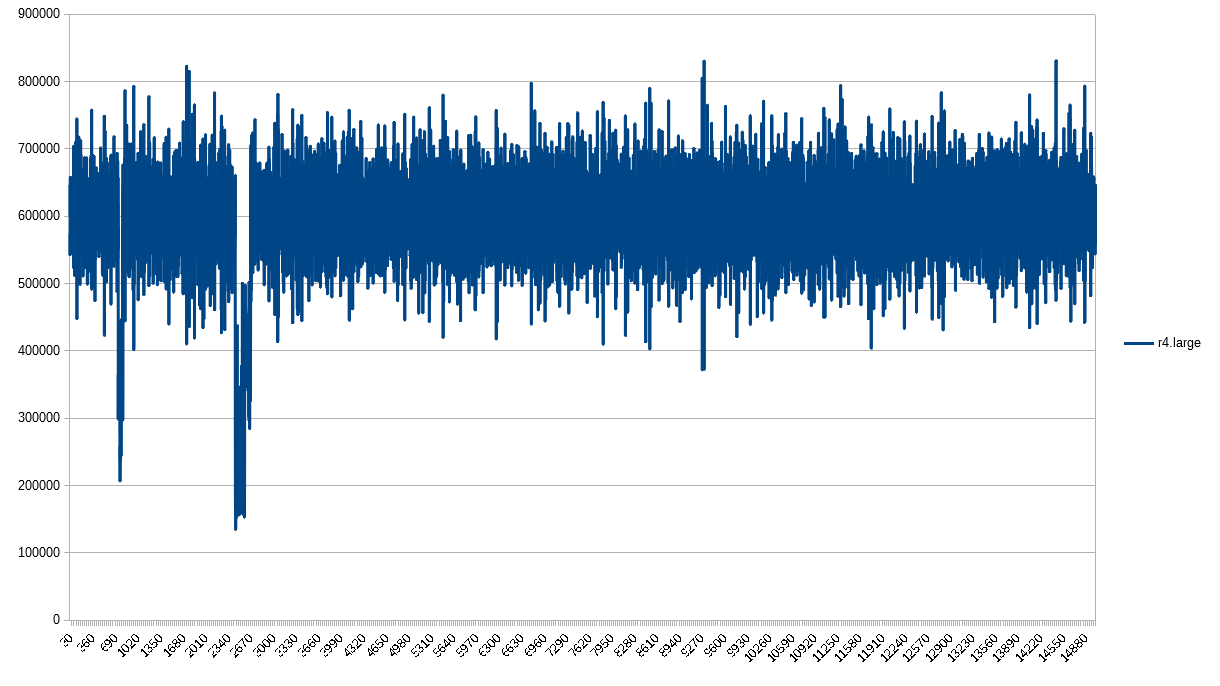
Looking good, r4.large. Thanks for following the rules.
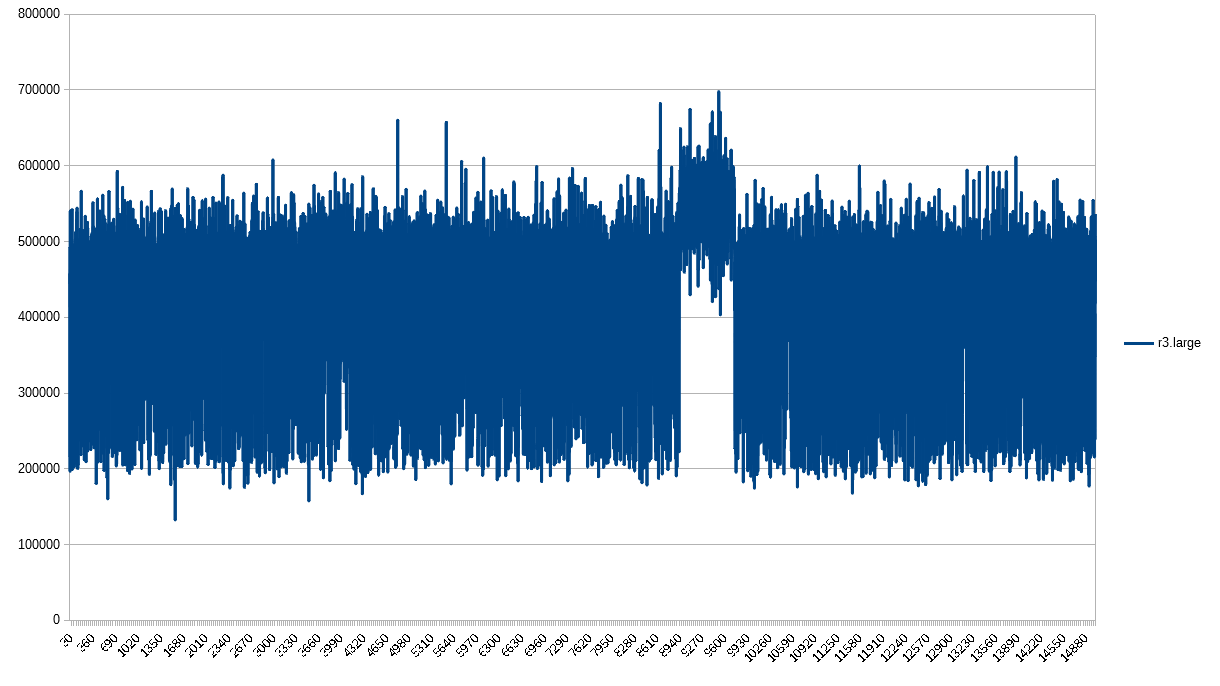
You too, r3.large. Good job!
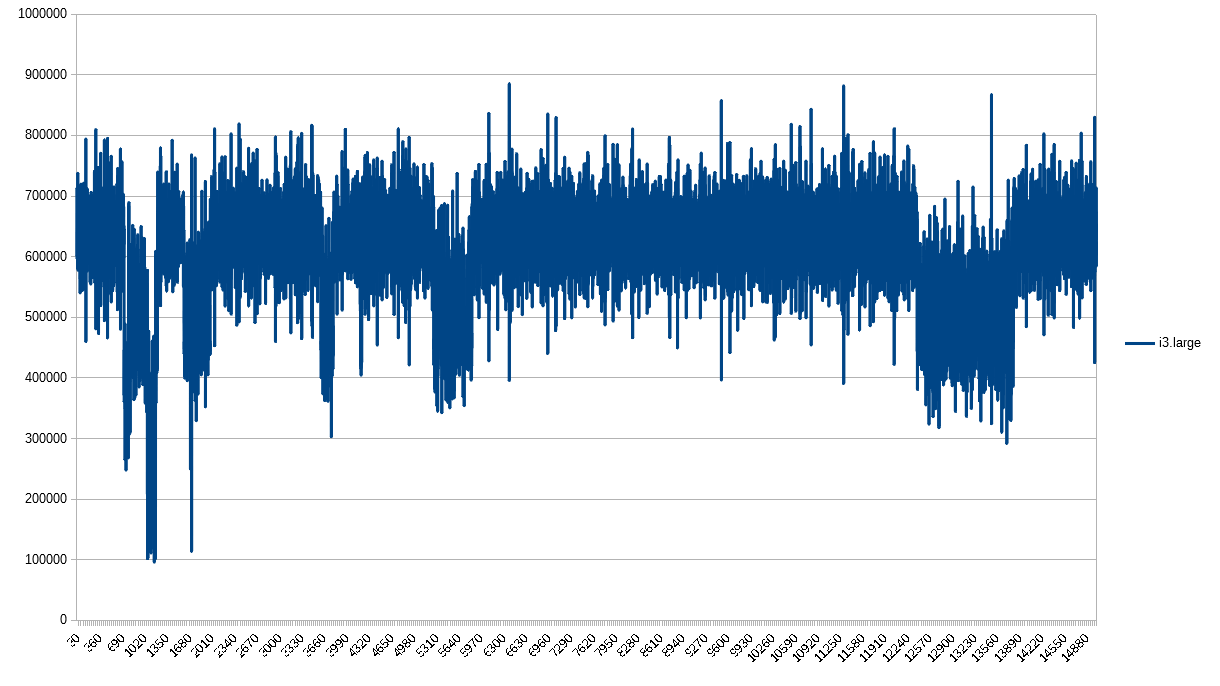
Finishing off strong, i3. Looks pretty consistent.
Again, I have no idea what to make of the root cause of why these graphs are so different, but we can organize them into a couple categories:
-
Equidistant spikes. I would think this is caused by the CPU credit mechanism in AWS, but the m4.large and t2.large ruin that theory. One that should have the spikes doesn’t, and one that shouldn’t does. No idea.
-
No surprises. Instances where there are clear high and lows, but no surprises. There are enough of these that I didn’t lose any more hair while writing this post.
-
No flipping clue. I’m staring at you, t2.nano. Why are there equidistant downward-facing spikes?
Given that EC2 instances have their own PPS profiles, it’s not that big of a leap to assume different bandwidth profiles, too. And if so, CPU, EBS access, DNS lookups, and more.
I know this argument is a strawman, and it may not hold up very well. Regardless, you would do well to realize that when you change instance types, there are more considerations than just CPU, memory, and cost.
AWS is a complex environment that’s growing faster than any one of its customers. Staying ahead of the curve will take more time than you have. Blue Matador monitors AWS with 20/20 vision, finding the unknowns in your infrastructure so you can focus on what matters.


