
![]() A customer of ours reported a limit on number of packets in Amazon’s EC2 instances. According to the report, it didn’t happen on all instance types, and didn’t happen all the time. Also, it was unrelated entirely to bandwidth or MTU. According to the report, packet transmission rates were limited the same as CPU on t2/t3 instances — each instance earns credits which, when exhausted, cause throttling.
A customer of ours reported a limit on number of packets in Amazon’s EC2 instances. According to the report, it didn’t happen on all instance types, and didn’t happen all the time. Also, it was unrelated entirely to bandwidth or MTU. According to the report, packet transmission rates were limited the same as CPU on t2/t3 instances — each instance earns credits which, when exhausted, cause throttling.
We at Blue Matador pride ourselves in finding the unknowns in your infrastructure, and we’d never heard of this before. Naturally we were curious. Our plan was to either apply this check across all of our customers automatically, or (if it wasn’t actually a problem) debunk the claim and disseminate the proof.
What I found was both conclusive and interesting.
This is the introductory post to our series investigating PPS measurements in Amazon EC2. Here are the other posts in the series:
- How many packets per second in Amazon EC2? (introduction / this post)
- EC2 packets per second: guaranteed throughput vs best effort
- Packets per second in EC2 vs Amazon’s published network performance
- Payload size doesn’t affect max PPS limit on AWS
- PPS spike every 110 seconds on EC2
- Using t1/t2/t3 unlimited to increase packet limitations
The Test
To max out the number of packets on an instance, I wrote a 242-line program in Golang. For each CPU on the server, the program creates a thread that floods the network with UDP packets to a local IP. Another thread tracked packets sent on a second-by-second basis.
In addition to the statistic thread, we also have graphs and metrics from Amazon Cloudwatch at 5-minute granularity. We enabled detailed monitoring, but the graphs at the 1-minute granularity are scatter-plots, not line graphs — thanks Cloudwatch.
We specifically use UDP packets (as opposed to TCP) because there are no handshakes, CLOSE_WAIT port statuses, or extra overhead on the OS. Also, we don’t want to set up a server to establish a connection with. We only care that the packets are transmitted, not received. These make UDP the better choice for the test.
If you’d like to see the code, or try the test on your own instance, we shared the code in a Github repository: https://github.com/bluematador/ec2-packet-limit
Setup in AWS
The setup in AWS is incredibly simple. Here’s what we did:
- No special security group rules. The golang program sends UDP packets to 172.31.155.155:1000. We do not have any server at this IP address listening for packets.
- We enabled Detailed Monitoring on each test server, but found it to be largely useless.
- Nothing else was running on these instances - no services, no cronjobs, no logins, no downloads, nothing.
- Single region, mostly single availability zones. Neither of these are required, but doing it this way made the setup, management, and reporting a lot easier.
- Our test was mostly on the cheapest type in a variety of instance generations. We ended up testing c1.medium, c3.large, c4.large, c5.large, i3.large, m1.large, m3.large, m4.large, m5.large, r3.large, r4.large, t1.micro, t2.large, t2.medium, t2.micro, t2.nano, and t2.small. This isn’t an exhaustive list, but it does give you an idea of the breadth we covered.
- I only tested a single instance from each generation, because each family is the same hardware, just different limits and pricing.
Here is our list of instances in the AWS console (after the test finished):
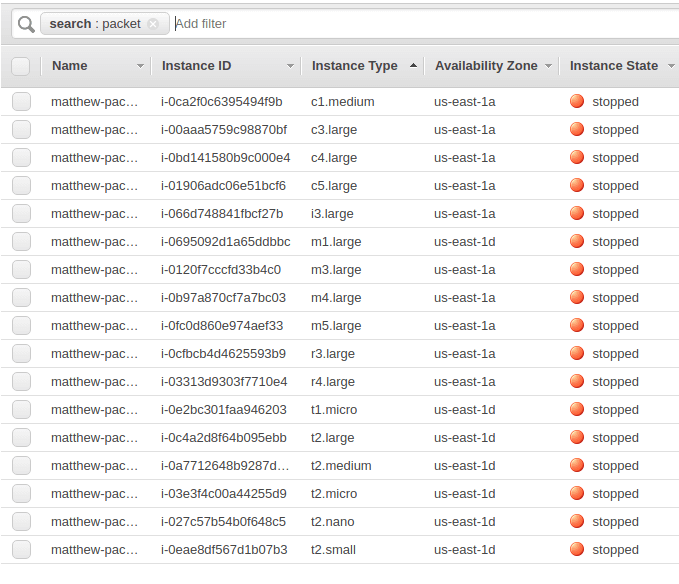
Once the code was written, the executable was distributed, and the environment was ready, we launched the test, and let it run for 24+ hours.
The Results
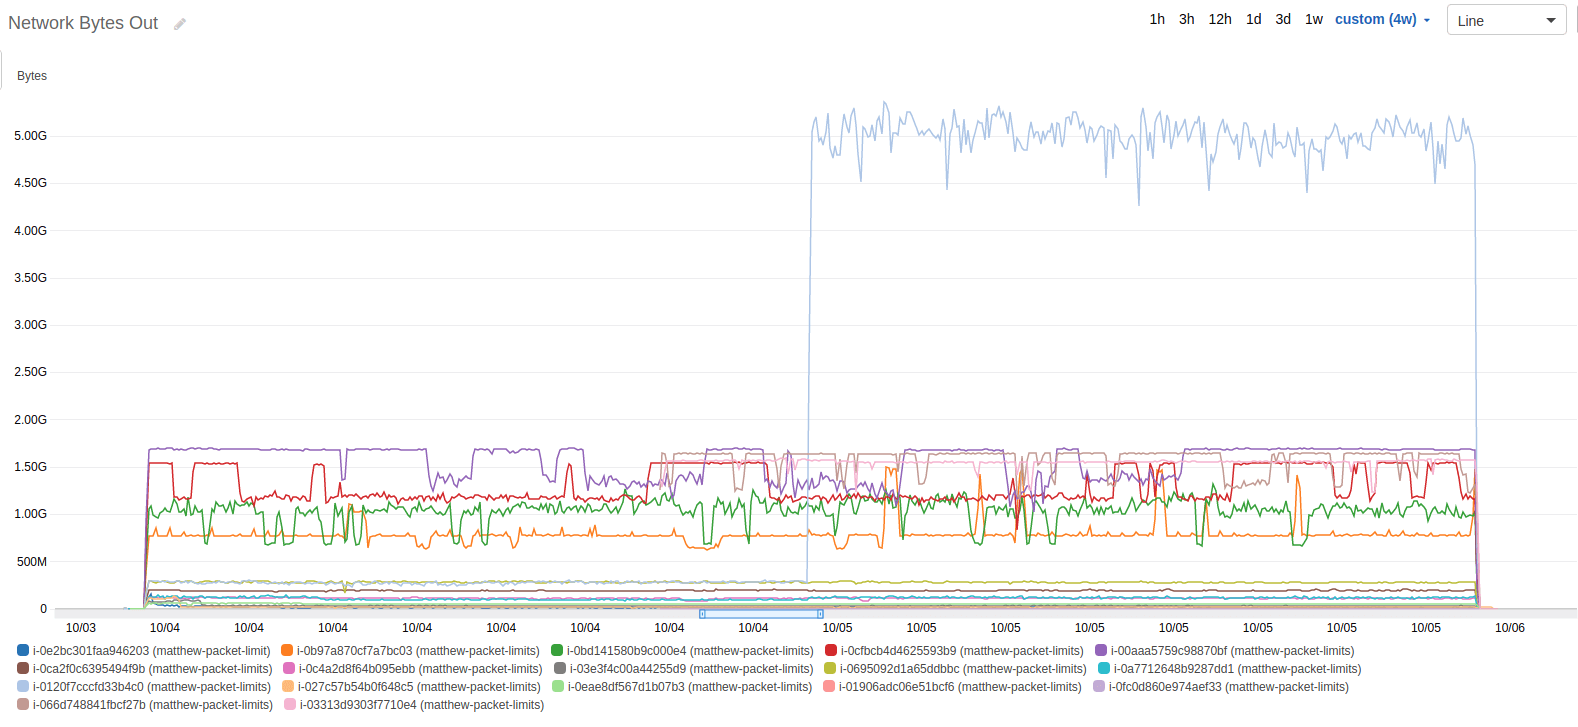
After running the test for 24 hours, I was anxious to see what kind of results I would find. I pulled up the Cloudwatch graphs and began looking for limitations, drops in usage, patterns, and anything else that emerged. Here’s the dataset that I looked at first, the network packets out.
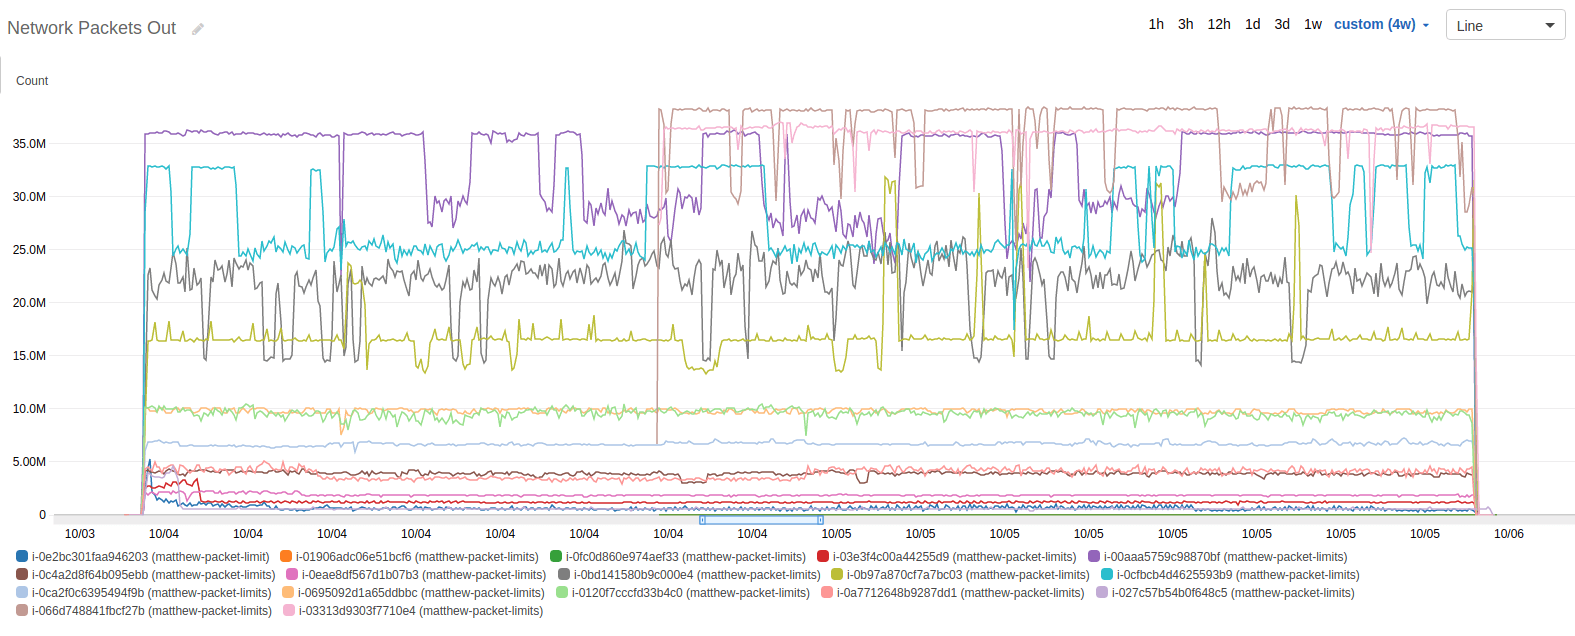
The first thing I noticed was the occasional drop in throughput, and that it seemed to have a repeating pattern, indicative of a credit mechanism like CPU credits. Unlike CPU credits, which remain exhausted until the demand slows down, these numbers would come back, intermittently. Over 24 hours, they seemed to toggle on and off.
The second thing I noticed was that there were some instance types that didn’t experience this toggling. In fact, it seems that the toggling only really affects the larger instance types (at least given this scale).
The previous graph was for the average number of packets. The graphs for max, min, sum, and count were basically the same graphs with slightly different scales.
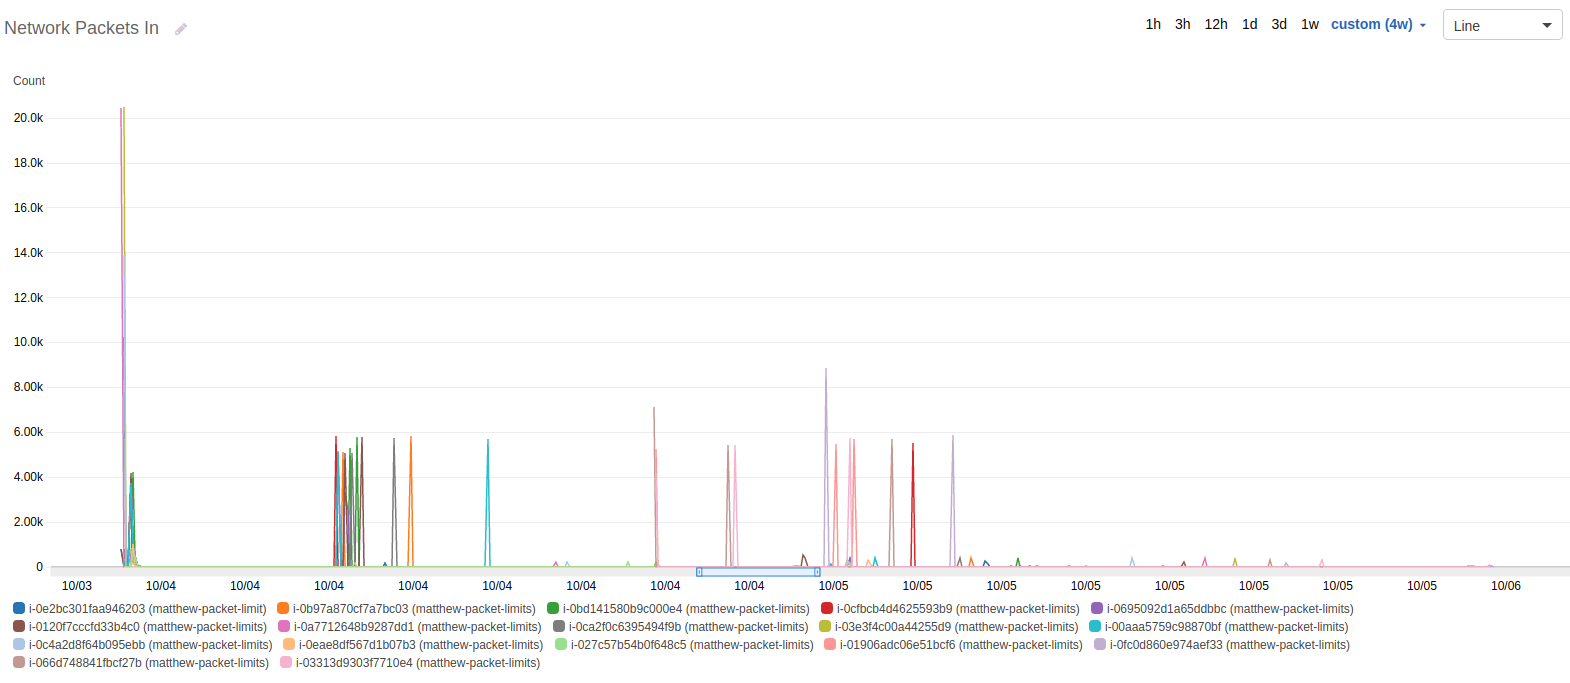
Next, I went to the received packets, but with a different purpose. My hope was that the number of packets in didn’t screw up my tests — they didn’t. We see in this graph that they stayed incredibly low compared to the packets out. Clearly, the servers were unencumbered by inbound packets, except my occasional checkin over SSH.
I had one major concern left after verifying that the systems remained untouched, the CPU utilization. While my program is incredibly short, I do have a number of threads, with a lot of context switching. Golang doesn’t have support for the sendmmsg function, which reduces context switches by sending multiple UDP packets at once. And, if the context switching took too much CPU, my program would only test the limits of CPU, not the network.
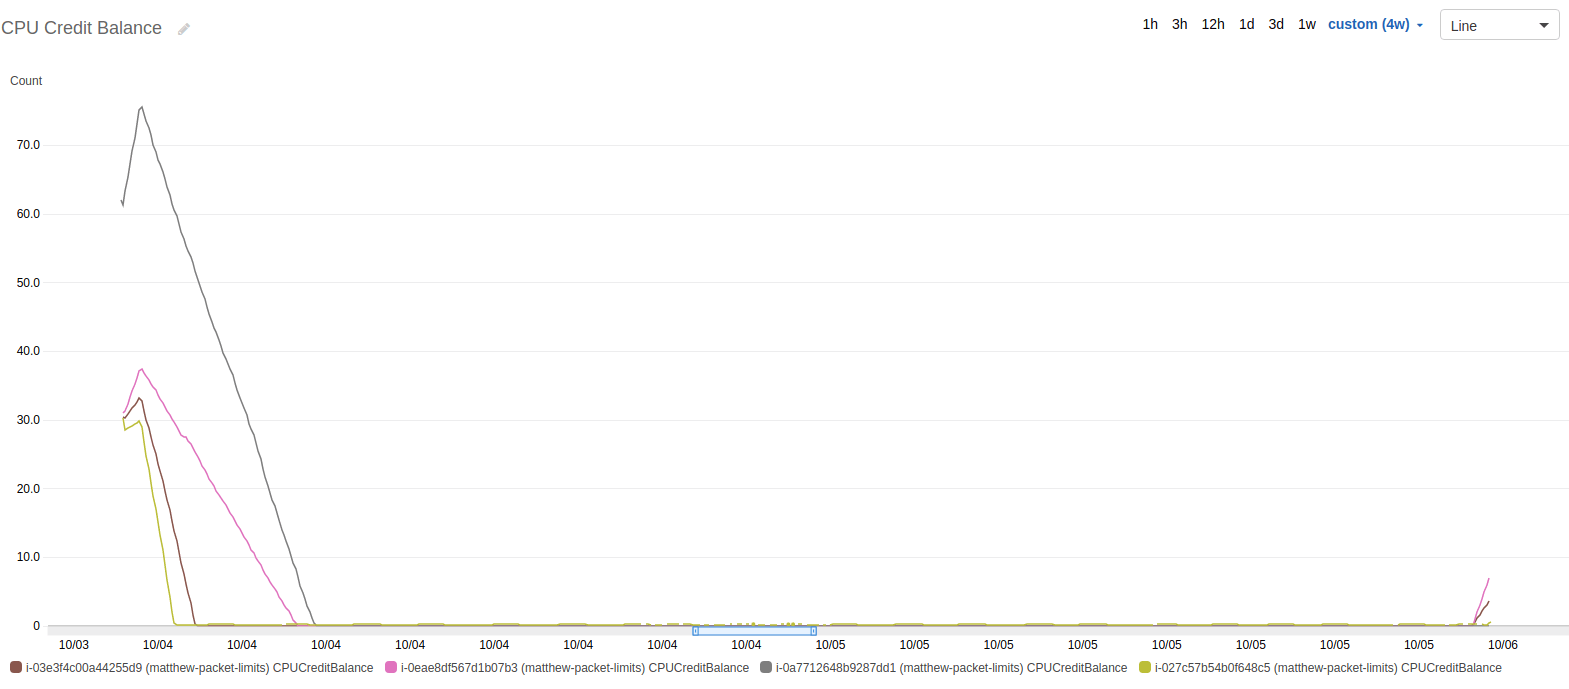
Below is the graph of CPU. You’ll notice that a couple of servers are pegged at 100%. Each of these servers is a t1, t2, or t3 server - which only have partial, burstable CPUs.
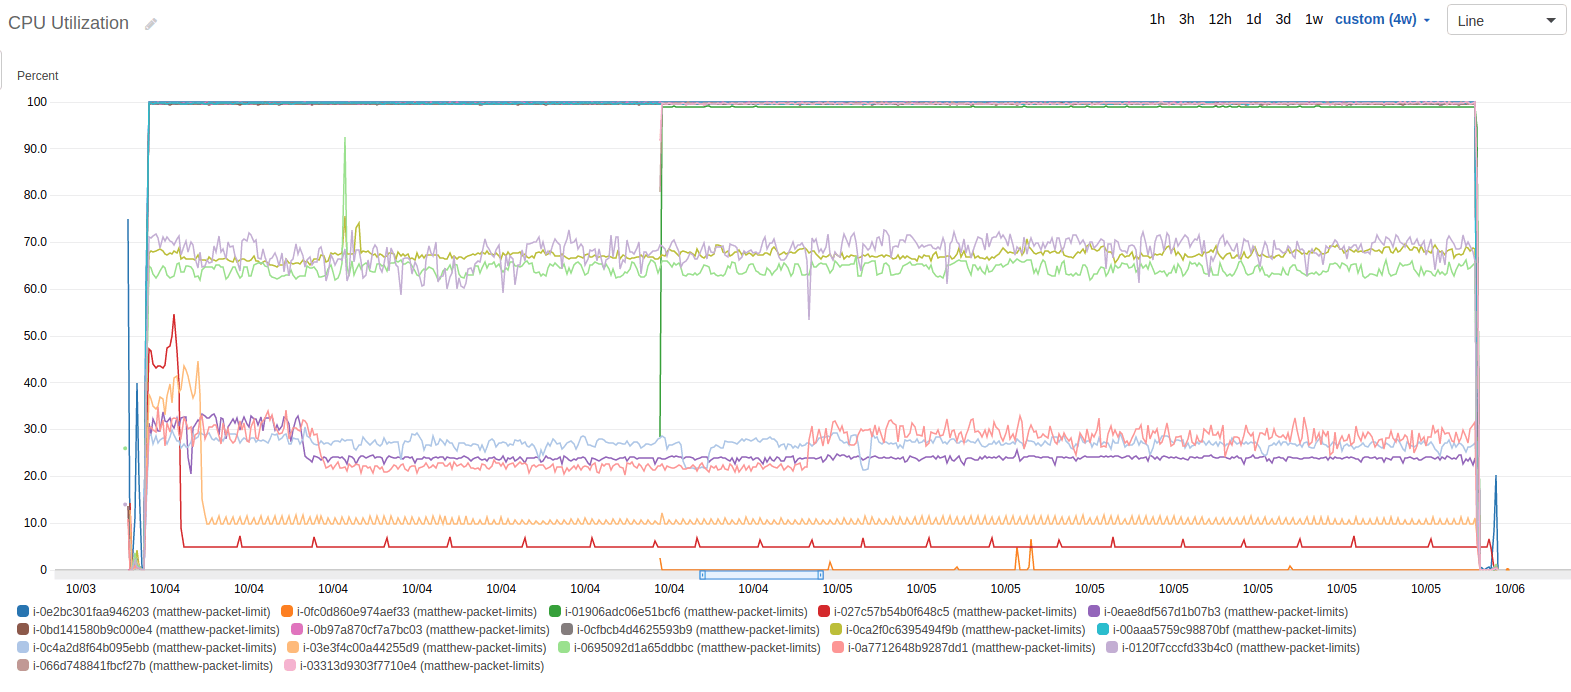
Although I was disappointed, I came to the conclusion that a burstable CPU would be the limit on these boxes anyway. Here is the graph of CPU credits of those instances.
There’s one more graph I looked at, bandwidth. The purple spike that stands out was a secondary test I had run half-way through to see if the payload affected the number of packets being sent.
Comparing the graphs of network bytes out and network packets out shows everything is in order, except for the payload test previously mentioned.
Breaking the Results Down
You know what I found during my initial run-through of the Cloudwatch data. I spent even more time analyzing the raw data, comparing to AWS published numbers and other blog posts, and trying to determine what I actually think about the validity of our customer’s claim about a credit balance and corresponding PPS limitation in EC2. I came up with way too much data over the course of weeks.
Here’s a taste of why my engineer eyes found the following points of interest in the graph, each of which I’ll cover in more detail in separate posts as part of this series.
- Two Limits: Guaranteed vs Best Effort. Given most instances, there seem to be two distinct thresholds — one upper and one lower.
- PPS vs Published Network Performance. There is not an obvious delineation between the “Low, Medium, High” network performance for packets when looking at these graphs above, but there is a correlation between PPS and network performance.
- Bandwidth Constraints. It’s difficult to see in the graph, because I ran a second test towards the end of the results, but the packet size and bandwidth are largely unrelated for testing maximum number of packets.
- PPS spike every 110 seconds. Every 110 seconds, the number of packets being sent out appear to increase for about 20 seconds, and then decrease again. You can’t tell in the graphs above, but it’s obvious using more granular data. Thanks Cloudwatch…
- T2/T3 Unlimited Helps. Again, difficult to see in the graph, but I enabled t2.unlimited on an instance. It helped, but not as much as I thought or expected.
I recommend reading the Two Limits post, it alone answers the question about credit balances and PPS limitations in AWS. The rest point to interesting things I found along the way.


