
This is the fourth post to our series investigating PPS measurements in Amazon EC2. Here are the other posts in the series:
- How many packets per second in Amazon EC2? (introduction)
- EC2 packets per second: guaranteed throughput vs best effort
- Packets per second in EC2 vs Amazon’s published network performance
- Payload size doesn’t affect max PPS limit on AWS (this post)
- PPS spike every 110 seconds on EC2
- Using t1/t2/t3 unlimited to increase packet limitations
Cloudwatch Fail
But first, a rant about Cloudwatch…
I’ve been writing this blog series over a long period of time. I knew that it would be a while before I wrote this post in particular. I made a list of the data I needed and granularity I needed it at. I needed these two things.
Packets per second at 1-second granularity. I knew Cloudwatch would suck here — it’s well documented that Cloudwatch only stores at 5 minute intervals (or 1 minute if you use detailed monitoring, which I did). Since I knew about this, I orchestrated my own statistics that are available in the Github repo for the benchmarking project.
Bytes per second at 5-minute granularity. In the main section of this post, I would have liked to have put a graph of my m3.large’s outgoing bandwidth compared to the outgoing packets per second. A 5-minute granularity was okay, because I didn’t need that many data points on the graph to show the lack of limitations on bandwidth. According to AWS’s post about new Cloudwatch retention (dated 1 Nov 2016):
One minute data points are available for 15 days.
Five minute data points are available for 63 days.
One hour data points are available for 455 days (15 months).
While still within the 63 days, I checked back for the metrics in Cloudwatch. They were gone. Now, to everyone familiar with Cloudwatch, there are two places you can check the metrics for EC2 instances. The first one is from EC2’s “Monitoring” tab. This tab only shows the last two weeks — I knew that wouldn’t work. The second one — the one I checked — is in the Cloudwatch console. And mine are nowhere to be found.
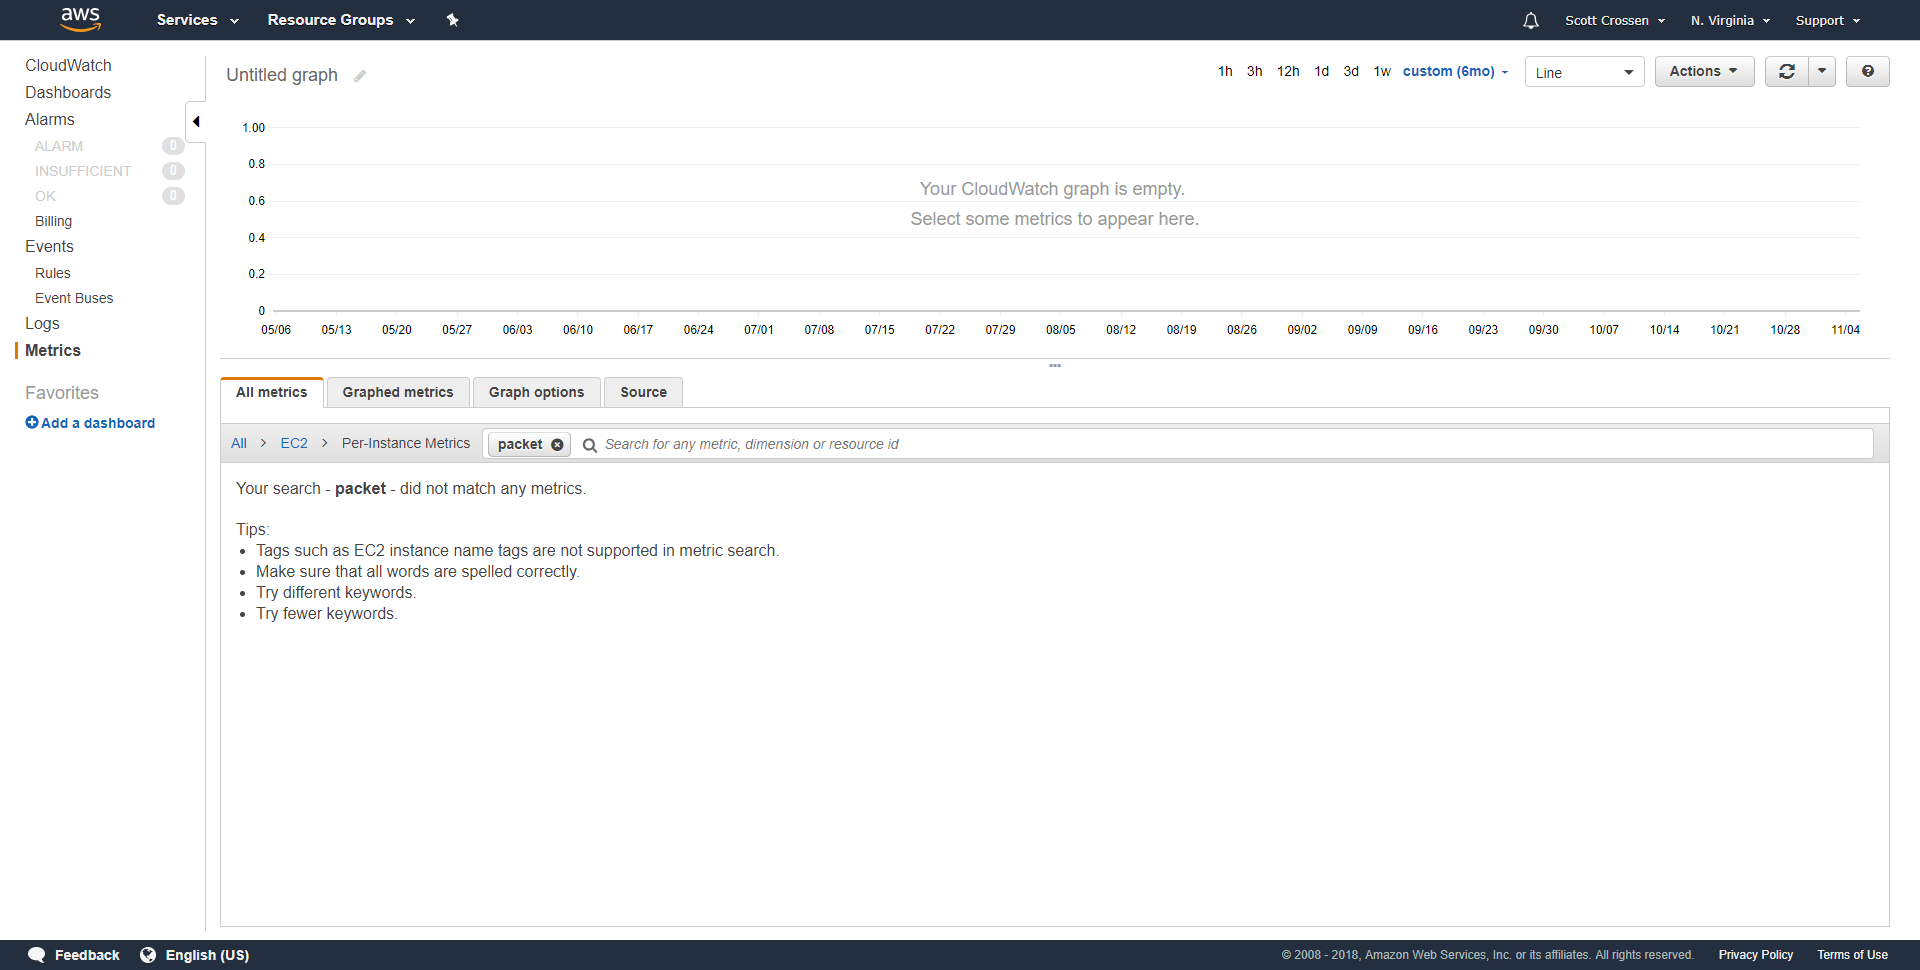
Notice that I’m looking for EC2 instance metrics with “packet” in the name, and there are none. I did this search on 5 Nov 2018, but the metrics were gone when I checked on 23 Oct 2018.
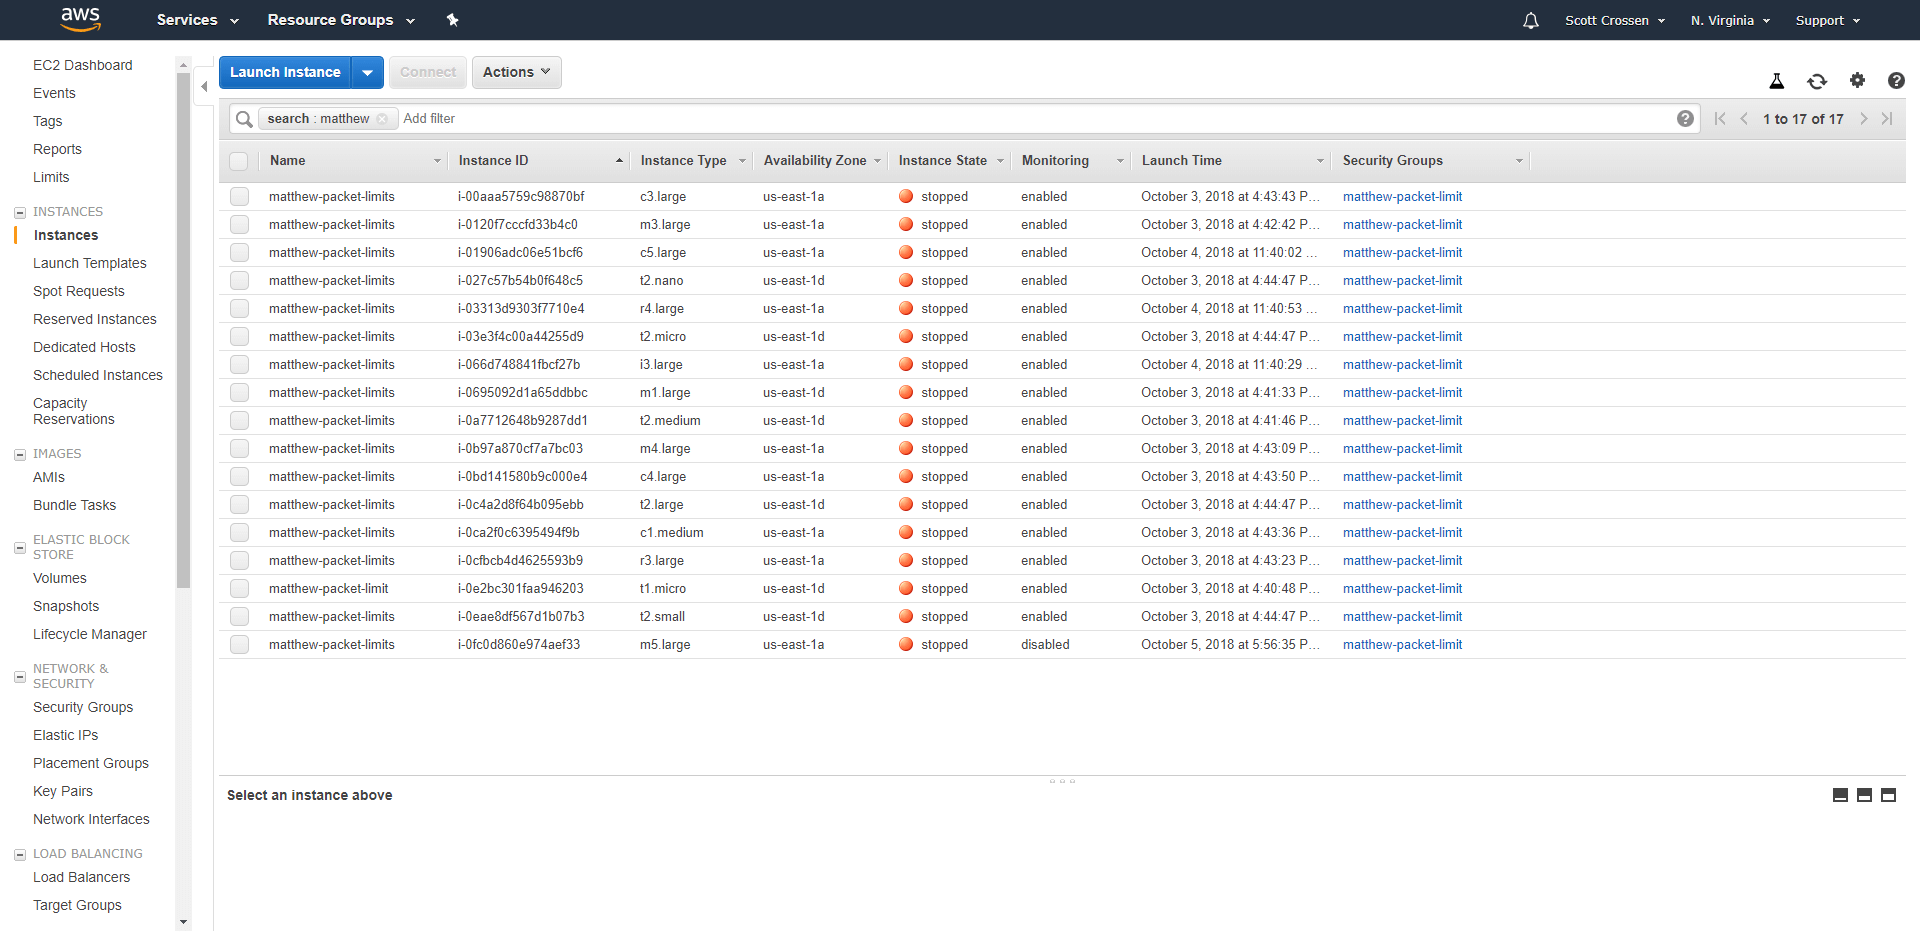
Each of my instances had “packet” in the name. I also tried searching for “matthew”, “limit”, as well as an empty search and looking through the metrics myself.
I suspect that there is an undocumented feature where Cloudwatch deletes metrics for Stopped instances after an undefined amount of time less than the published number. That’s the only thing that makes sense. But, for a product that seems to have a lot of documentation, release logs, and visibility, Cloudwatch definitely messed up this time.
Rant over… On to the main event.
Increased Payload, No Impact
In the middle of the PPS test, and while all the rest of the servers continued running unaffected, I stopped the test on my m3.large instance, and made a change to the running application. I commented out the packet size [1] and replaced it with a larger amount [500].
const PACKET_SIZE = 500 // 1 The MTU on Amazon’s network is 1,500 bytes, so my large payload still fits securely inside of a single UDP packet. The only change I expected to see was the bytes per second. The only data I have of bandwidth is with all the tested servers. I wanted to show just the single m3.large, but Cloudwatch lost my data (see previous heading).
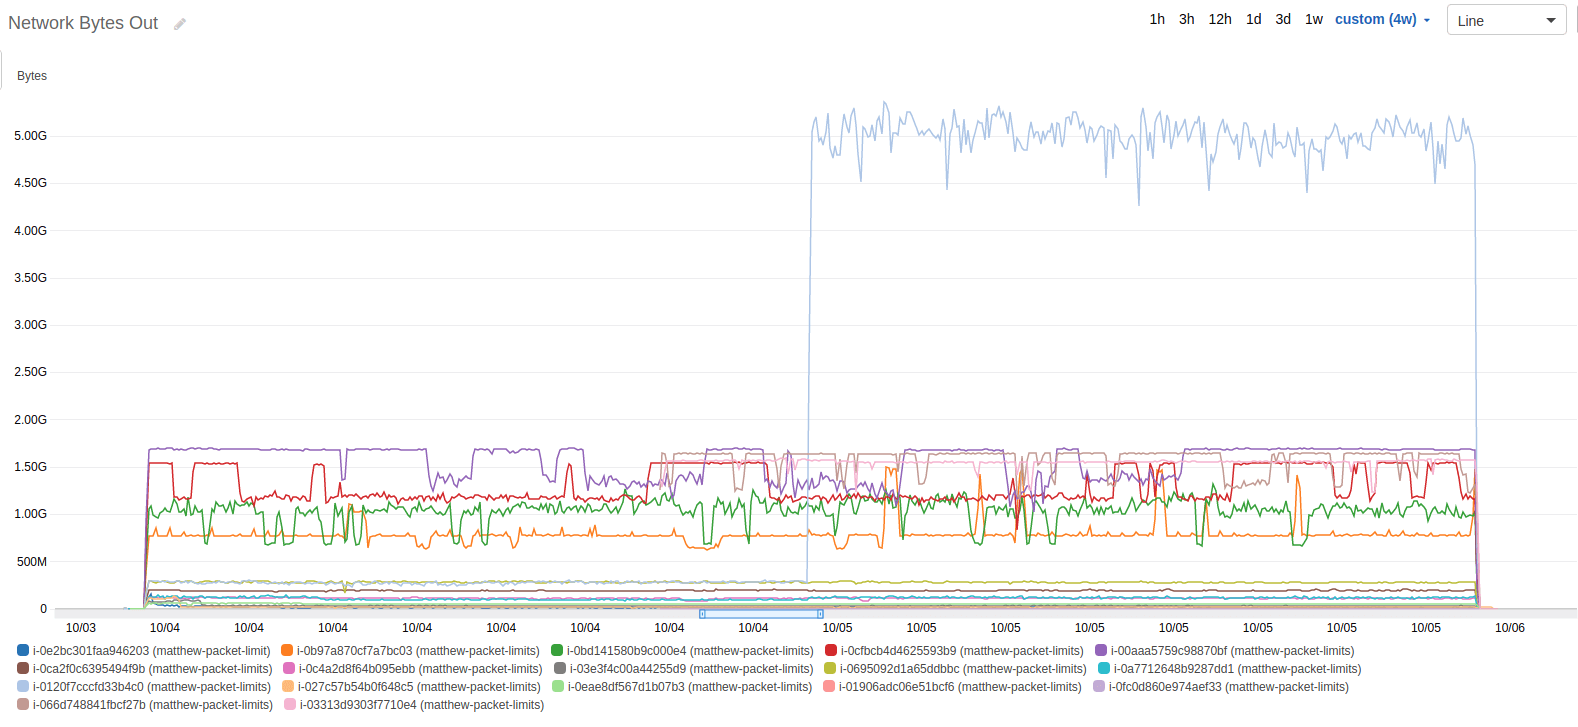
At 5:01pm MST on 4 Oct, I changed the payload size from 1 byte to 500 bytes on the m3.large instance.
The effect on bandwidth is pretty obvious in the graph, that confirms that my code change was in effect. As for the PPS, I expected no change whatsoever, but was a little surprised at seeing the graph:
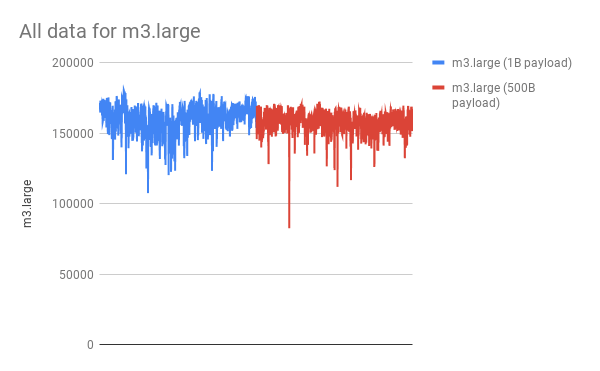
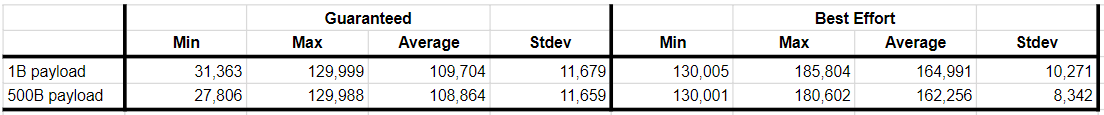
In blue, the data for the 1B payload. In red, the data for the 500B payload. Notice that they’re not quite the same.
While the graph is basically the same, if you stare at it for a few more seconds, you’ll notice that the average PPS for a 1B payload is slightly higher than the average PPS for a 500B payload. In fact, sending larger payloads decreased the average PPS by 1.52%.
When you include the guaranteed throughput vs best effort in the mix, the numbers are a little different, but larger payloads still get the shaft. For guaranteed throughput, larger payloads have, on average, 0.77% less PPS; and for best effort, larger payloads have, on average, 1.66% less PPS. All my data is contained in this Google Sheet. Like before, some of my calculations are performed using scripts on the raw 1-second data contained in the Github repo, because Sheets can’t handle that much data.
While it is a measurable difference, and certainly interesting visibility into AWS networking internals, I am not suggesting that you should optimize your application to send smaller payloads across the network. That’s a dumb idea.
I am, however, suggesting that there are a lot of moving parts when you’re hosted in AWS. If you have mission-critical software running in the cloud, you need the experts managing your alerting. Blue Matador autonomously regulates your alerts and thresholds, without your input, to notify you of alerts, warnings, and anomalies that are threats.


